


151/171
\begin{frame}
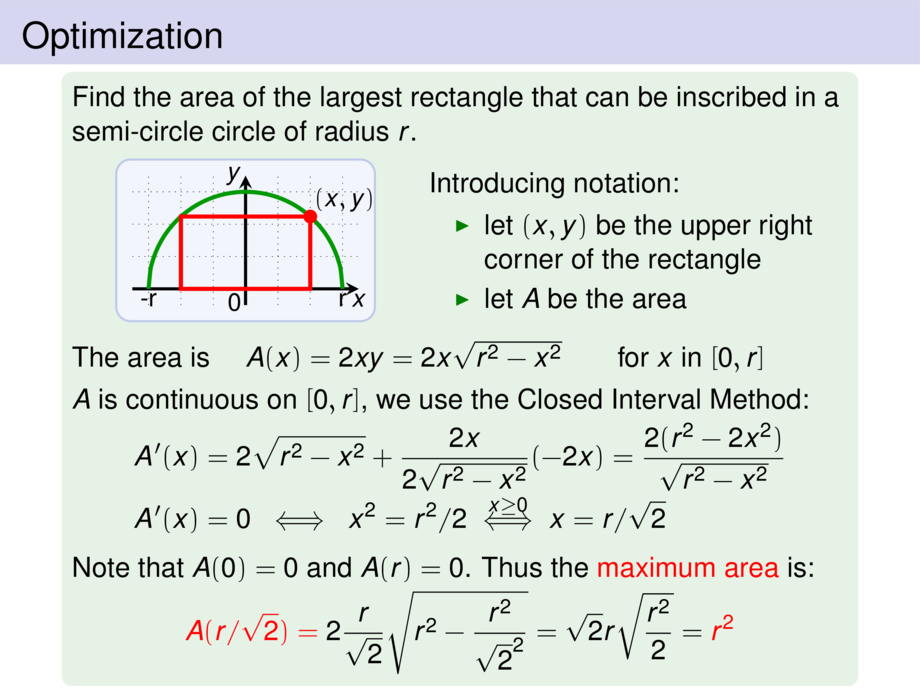
\frametitle{Optimization}
\vspace{-1ex}
\begin{exampleblock}{}
A store sells 100 blu-ray players per week for $200$\$ each.
A market survey shows that for each $10$\$ discount, the store would sell $40$ more players per week.
The store buys the players at a price of $150$\$ per piece.
\pause\smallskip
What selling price would maximize the profit of the store?
\pause\smallskip
\begin{overlayarea}{\textwidth}{5cm}
\only<-22>{
Introducing notation:
\begin{itemize}
\pause
\item let $x$ be the discount
\pause
\item let $s$ be the number of players sold, and $p$ the profit
\end{itemize}\vspace{-1ex}
\pause
\begin{talign}
s(x) &= \mpause[1]{100 + 40\cdot \frac{x}{10}} \mpause{ = 100 + 4x}\\[-.5ex]
\mpause{p(x) &= }\mpause{s(x) \cdot (200 - x - 150)} \mpause{ = (100 + 4x) \cdot (50-x)}\\[-.5ex]
\mpause{&= -4x^2 + 100x + 5000} \hspace{1cm} \mpause{\text{for $x$ in $[\mpause[8]{0},\mpause[8]{50}]$}}\\[-.5ex]
\mpause[9]{p'(x) &= -8x + 100} \hspace{1cm} \mpause{p'(x) = 0 \;\iff\; }\mpause{x=12.5}
\end{talign}
\pause\pause\pause\pause\pause\pause\pause\pause\pause\pause\pause\pause
Note that $p(x)$ is continuous\pause, and\vspace{-1ex}
\begin{talign}
p(0) &= \mpause[1]{5000} &
p(12.5) &= \mpause[2]{5625} &
p(50) = \mpause[1]{0}
\end{talign}
\pause\pause\pause
}
\only<23>{
\begin{center}
\begin{tikzpicture}[default,scale=.65]
\def\diaborderx{1.2cm}
\def\diay{$p(x)$}
\diagram{-0.5}{5}{-.5}{6}{1}
\diagramannotatexx{1/10,2/20,3/30,4/40}
\diagramannotateyy{1/1000,2/2000,3/3000,4/4000,5/5000}
\diagramannotatez
\begin{scope}[ultra thick]
\draw[cgreen] plot[smooth,domain=0:5,samples=100] function{(100 + 4*10*x) * (50-10*x)/1000};
\end{scope}
\end{tikzpicture}
\end{center}
}
\end{overlayarea}
By the Closed Interval Method, \alert{$12.5$\$ discount for maximal profit}.\hspace*{-10ex}
\end{exampleblock}
\end{frame}