

25/154
\begin{frame}
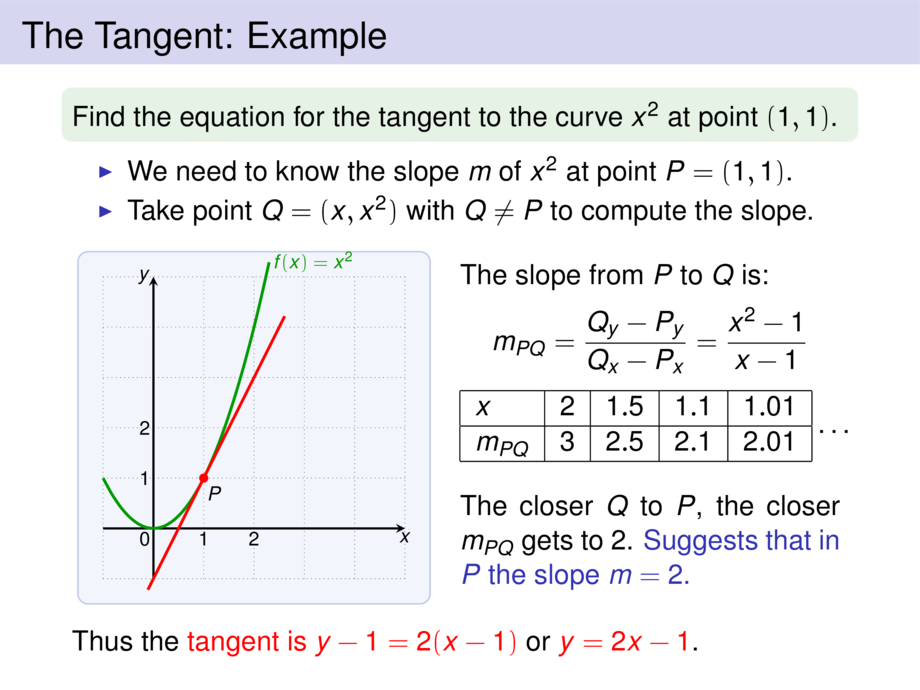
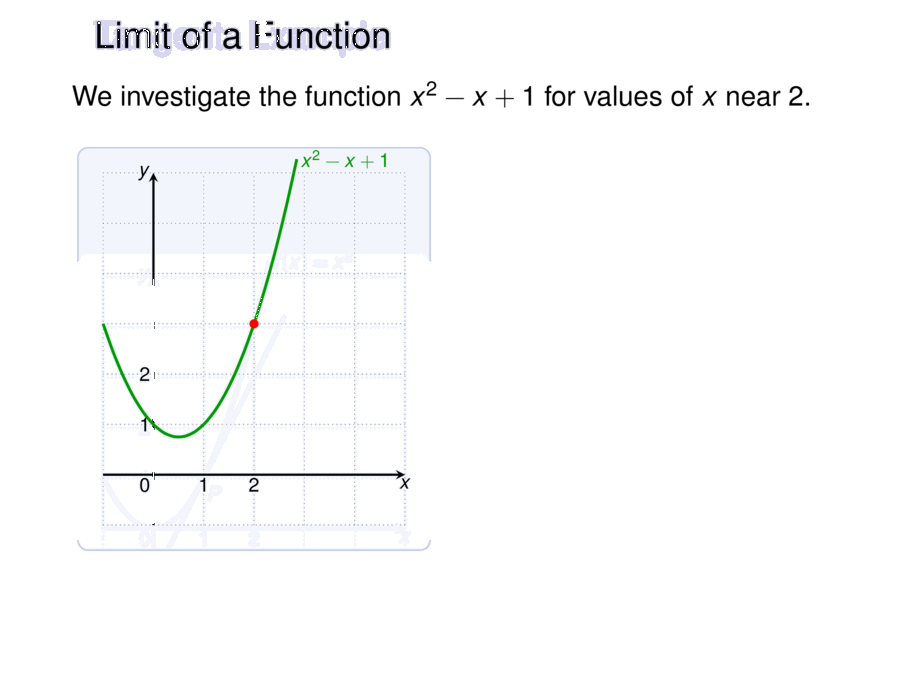
\frametitle{The Limit of a Function}
We investigate the function $x^2-x+1$ for values of $x$ near $2$.
\bigskip
\begin{minipage}{.49\textwidth}
\scalebox{.7}{
\begin{tikzpicture}[default]
\diagram{-1}{5}{-1}{6}{1}
\diagramannotate
\draw[ultra thick,cgreen] plot[smooth,domain=-1:2.85,samples=20] function{x**2-x+1} node[right] {$x^2-x+1$};
\node[dot] (P) at (2,{2^2-2+1}) {};
\end{tikzpicture}
}
\end{minipage}
\begin{minipage}{.49\textwidth}
\pause
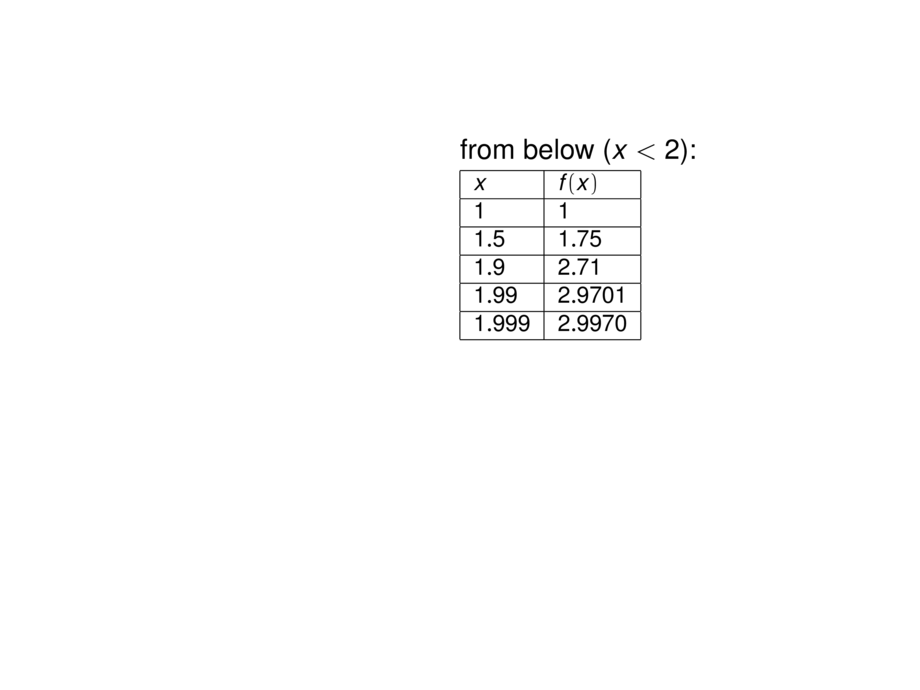
from below ($x < 2$):\\[.2ex]
\scalebox{.9}{\small
\begin{tabular}{|l|l|}
\hline
$x$ & $f(x)$ \\
\hline
$1$ & $1$ \\
\hline
$1.5$ & $1.75$ \\
\hline
% $1.8$ & $2.44$ \\
% \hline
$1.9$ & $2.71$ \\
\hline
$1.99$ & $2.9701$ \\
\hline
$1.999$ & $2.9970$ \\
\hline
\end{tabular}
}
\medskip\pause
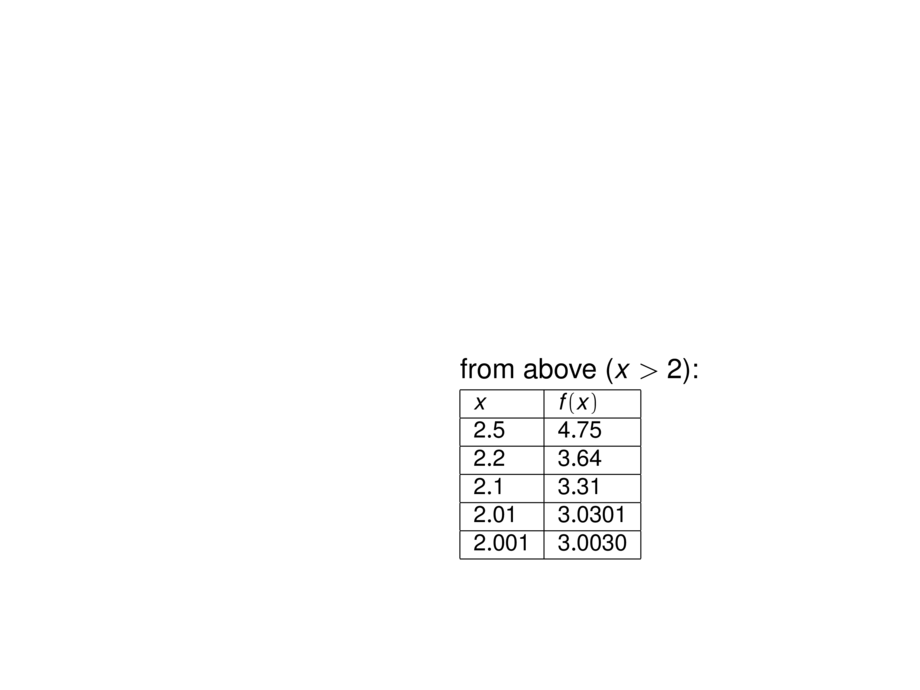
from above ($x > 2$):\\[.2ex]
\scalebox{.9}{\small
\begin{tabular}{|l|l|}
\hline
$x$ & $f(x)$ \\
\hline
% $3$ & $7$ \\
% \hline
$2.5$ & $4.75$ \\
\hline
$2.2$ & $3.64$ \\
\hline
$2.1$ & $3.31$ \\
\hline
$2.01$ & $3.0301$ \\
\hline
$2.001$ & $3.0030$ \\
\hline
\end{tabular}
}
\end{minipage}
\medskip\pause
From the tables we see: as $x$ approaches $2$, $f(x)$ approaches $3$.
\begin{talign}
\lim_{x\to 2} (x^2 - x + 1) = 3
\end{talign}
\end{frame}