

14/122
\begin{frame}{DFAs as Transition Graphs}
\begin{block}{}
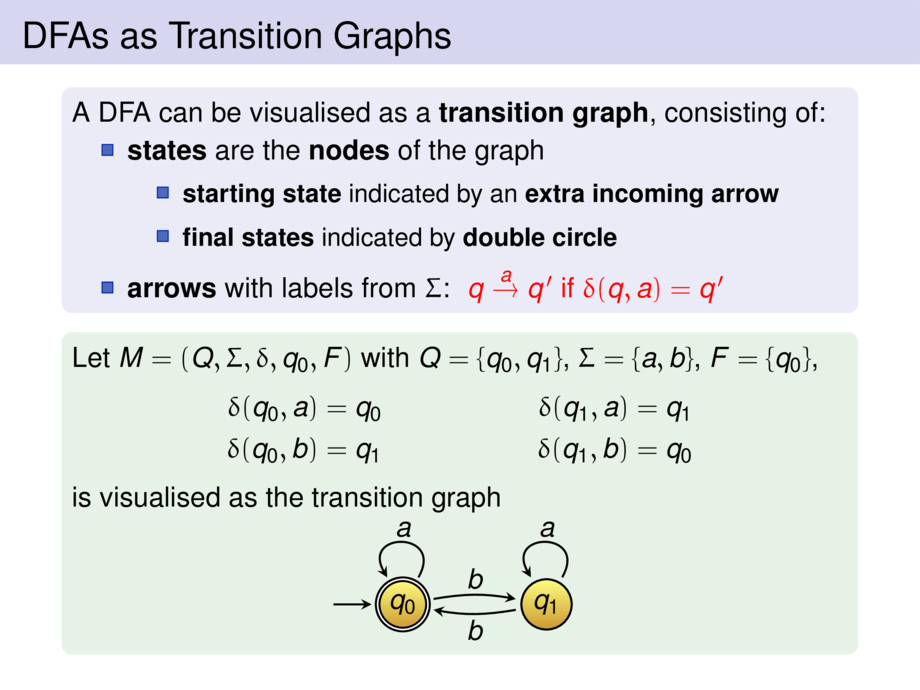
A DFA can be visualised as a \emph{transition graph}, consisting of:
\begin{itemize}
\item \emph{states} are the \emph{nodes} of the graph
\begin{itemize}
\item \emph{starting state} indicated by an \emph{extra incoming arrow}
\item \emph{final states} indicated by \emph{double circle}
\end{itemize}
\item \emph{arrows} with labels from $\Sigma$:\; \alert{$q \stackrel{a}{\to} q'$ if $\delta(q,a) = q'$}
\end{itemize}
%We have an \alert{arrow from $q$ to $q'$ with label $a$ if $\delta(q,a) = q'$}.
\end{block}
\begin{exampleblock}{}
\edfa
is visualised as the transition graph
\begin{center}\vspace{-1.5ex}
\input{tikz/dfa_even_bs.tex}
\end{center}
\end{exampleblock}
\bigskip
% \begin{exampleblock}{}
% \begin{minipage}{.2\textwidth}
% $\Sigma=\{\,a,b\,\}$\\[14ex]
% \end{minipage}
% \begin{minipage}{.79\textwidth}
% \centering
% \input{tikz/dfa2.tex}
% \end{minipage}
% \end{exampleblock}
\end{frame}