

12/50
\begin{frame}
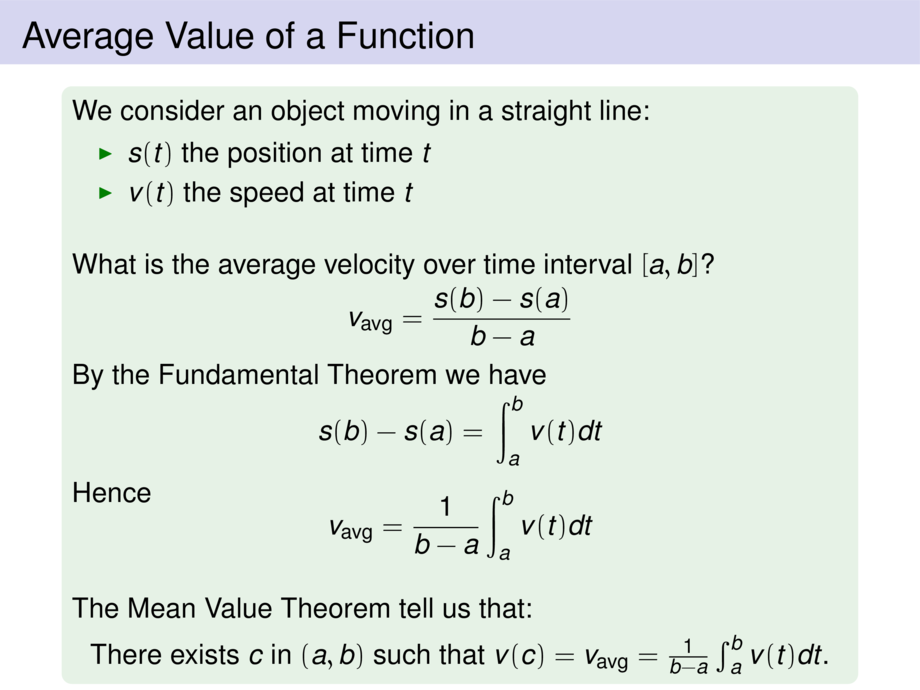
\frametitle{Average Value of a Function}
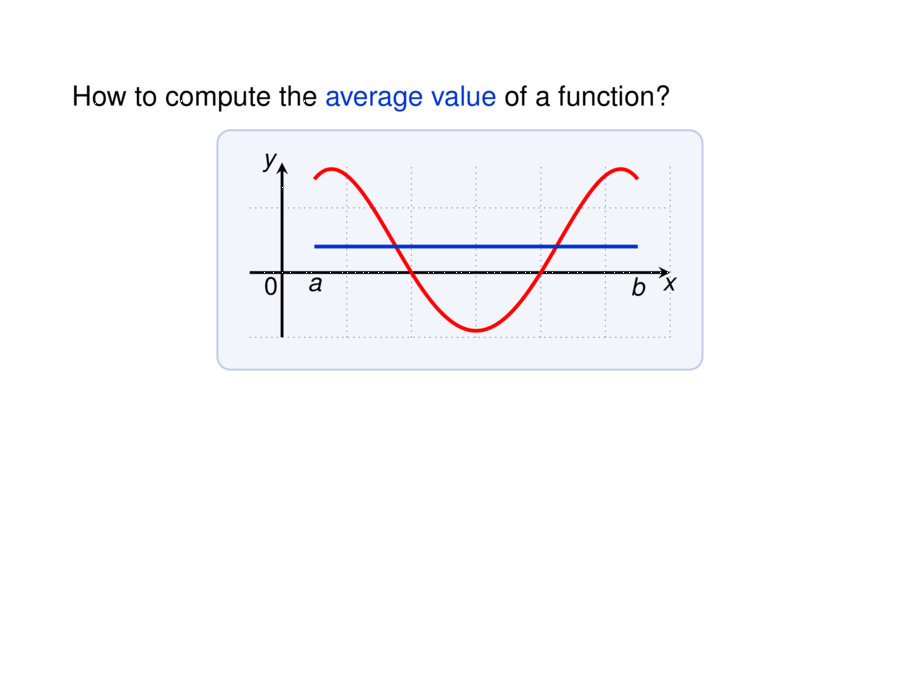
How to compute the \textcolor{cblue}{average value} of a function?
\begin{center}
\scalebox{.9}{
\begin{tikzpicture}[default]
\def\mfun{(-.9 + (\x-3+\mfunshift)^2 - .1*(\x-3+\mfunshift)^4)}
\diagram[1]{-.5}{6}{-1}{1.7}{1}
\diagramannotatez
\def\mfunshift{0}
\begin{scope}[ultra thick]
\draw[cred] plot[smooth,domain=.5:5.5,samples=100] (\x,{\mfun});
\node[anchor=north] at (.5,0) {$a$};
\node[anchor=north] at (5.5,0) {$b$};
\only<1>{
\draw[cblue] (.5,2.01042/5) -- (5.5,2.01042/5);
}
\only<2->{
\def\mwidth{5}
\foreach \nrsteps/\mcolor in {6/cred} {
\def\mstep{\mwidth/(\nrsteps+1)}
\def\mfunshift{.5*\mstep}
\foreach \xx in {0,...,\nrsteps} {
\def\x{.5+ \xx*\mstep}
\pgfmathparse{{\mfun}}
\ifthenelse{\lengthtest{\pgfmathresult cm > 0cm}}{
\def\mcolor{cgreen}
}{}
\draw[thick,draw=\mcolor!60!black,fill=\mcolor,opacity=.5] ({\x},0) rectangle ({\x+\mstep},{\mfun});
\node[include=\mcolor] at ({\x+\mfunshift},{\mfun}) {};
}
}
}
\end{scope}
\end{tikzpicture}
}
\end{center}\vspace{-.75ex}
\pause
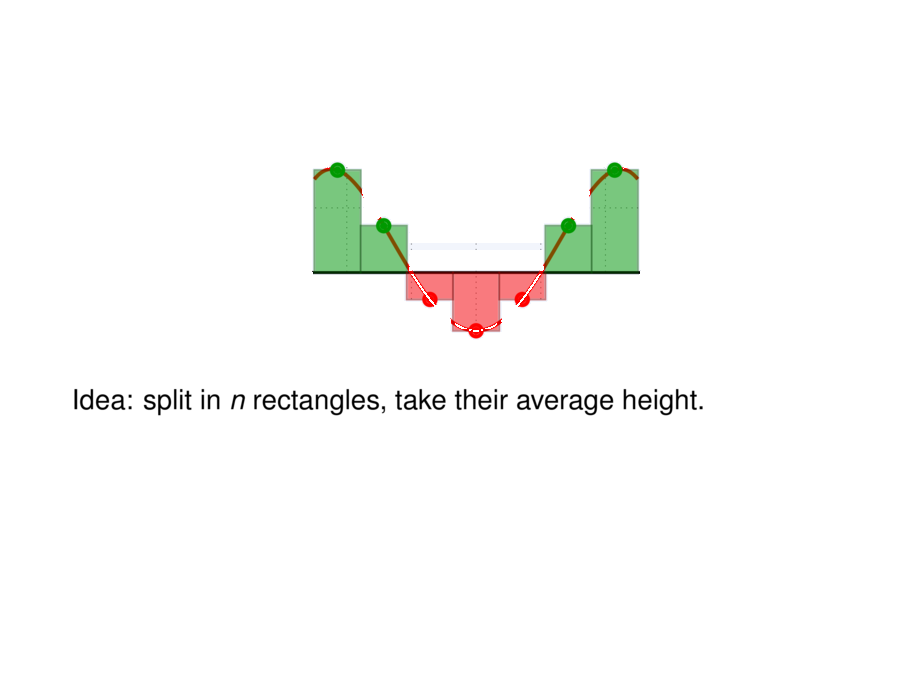
Idea: split in $n$ rectangles, take their average height.
\pause
\begin{talign}
\frac{f(x_1) + f(x_2) + \ldots + f(x_n)}{n}
\mpause[1]{ &= \frac{1}{n}\sum_{i = 1}^n f(x_i) }
\mpause{= \frac{1}{n\;\Delta x}\sum_{i = 1}^n f(x_i)\Delta x} \\[-.5ex]
\mpause{&= \frac{1}{b-a}\sum_{i = 1}^n f(x_i)\Delta x}
\end{talign}\vspace{-1ex}
\pause\pause\pause\pause
\begin{block}{}
The sum \quad \alert{$\sum_{i = 1}^n f(x_i) \Delta x$} \quad
is called \emph{Riemann sum}.
\end{block}
\vspace{10cm}
\end{frame}