

29/46
\begin{frame}
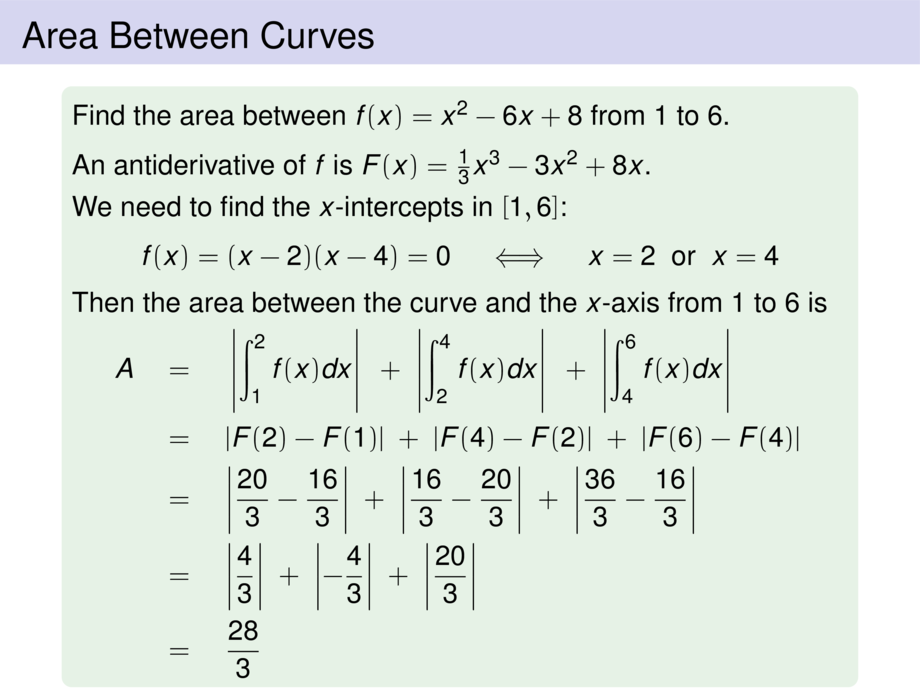
\frametitle{Area Between Curves}
\begin{block}{}
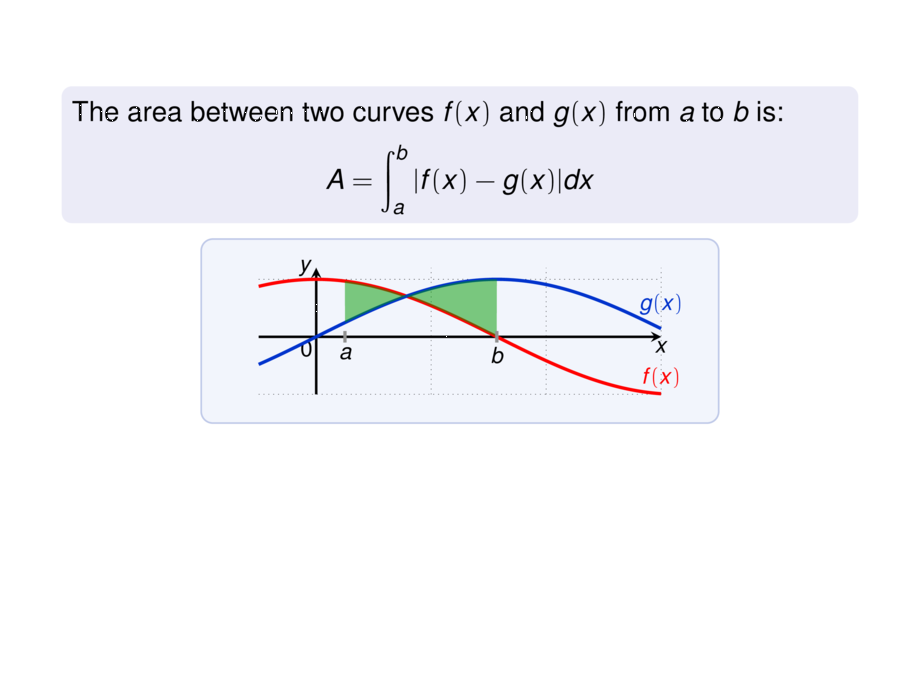
The area between two curves $f(x)$ and $g(x)$ from $a$ to $b$ is:
\begin{talign}
A = \int_a^b |f(x) - g(x)|dx
\end{talign}
\end{block}
\begin{center}
\scalebox{.8}{
\begin{tikzpicture}[default,xscale=2]
\def\mfuna{(cos (180/pi *\x))}
\def\mfunb{(sin (180/pi *\x))}
\diagram[1]{-.5}{3}{-1}{1.2}{1}
\diagramannotatez
\def\mfunshift{0}
\begin{scope}[ultra thick]
\draw[cred] plot[smooth,domain=-.5:3,samples=100] (\x,{\mfuna}) node[above] {$f(x)$};
\draw[cblue] plot[smooth,domain=-.5:3,samples=100] (\x,{\mfunb}) node[above,yshift=1.5mm] {$g(x)$};
\draw[fill=cgreen,draw=none,opacity=.5] plot[smooth,domain=.25:pi/4,samples=100] (\x,{\mfuna}) -- plot[smooth,domain=pi/4:.25,samples=100] (\x,{\mfunb}) -- cycle;
\draw[fill=cgreen,draw=none,opacity=.5] plot[smooth,domain=pi/4:pi/2,samples=100] (\x,{\mfuna}) -- plot[smooth,domain=pi/2:pi/4,samples=100] (\x,{\mfunb}) -- cycle;
\draw[gray] (.25,.1) -- node[at end,below,black] {$a$} (.25,-.1);
\draw[gray] (pi/2,.1) -- node[at end,below,black] {$b$} (pi/2,-.1);
\end{scope}
\end{tikzpicture}
}\\[1ex]
\pause
\alert{The area between $f$ and $g$ = area between $f-g$ and the $x$-axis.}\\[.2ex]
\scalebox{.8}{
\begin{tikzpicture}[default,xscale=2]
\def\mfun{(cos (180/pi *\x) - sin (180/pi *\x))}
\diagram[1]{-.5}{3}{-1}{1.2}{1}
\diagramannotatez
\def\mfunshift{0}
\begin{scope}[ultra thick]
\draw[cgreen] plot[smooth,domain=-.5:3,samples=100] (\x,{\mfun}) node[above] {$f(x)-g(x)$};
\draw[fill=cgreen,draw=none,opacity=.5] plot[smooth,domain=.25:pi/2,samples=100] (\x,{\mfun}) -- (pi/2,0) -- (.25,0) -- cycle;
\draw[gray] (.25,.1) -- node[at end,below,black] {$a$} (.25,-.1);
\draw[gray] (pi/2,.1) -- node[at end,below,black] {$b$} (pi/2,-.1);
\end{scope}
\end{tikzpicture}
}
\end{center}
\end{frame}