

8/111
\begin{frame}
\frametitle{The Definite Integral}
\begin{block}{}
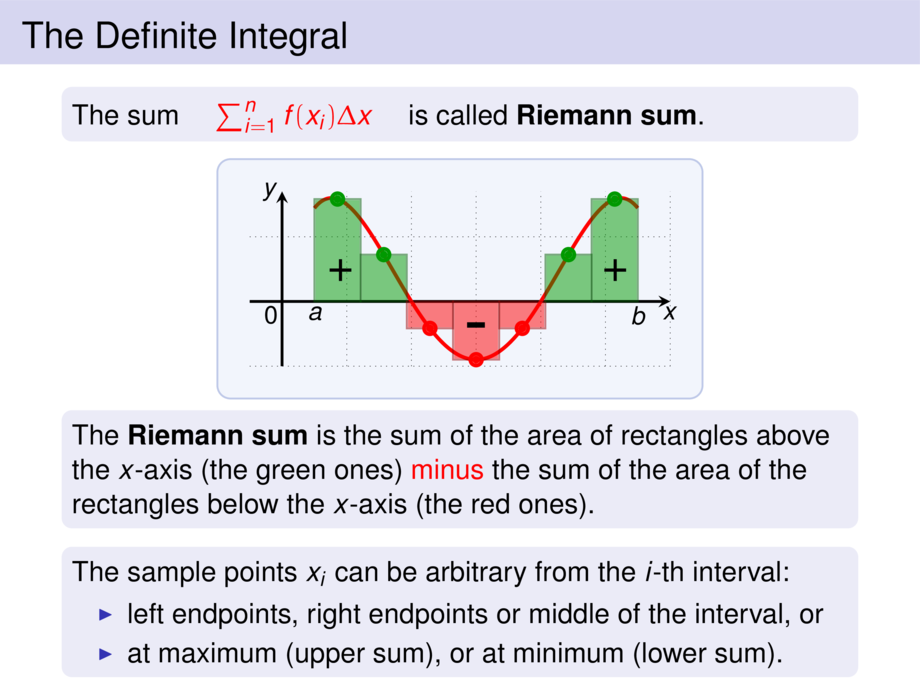
The sum \quad \alert{$\sum_{i = 1}^n f(x_i) \Delta x$} \quad
is called \emph{Riemann sum}.
\end{block}
\begin{center}
\scalebox{.9}{
\begin{tikzpicture}[default]
\def\mfun{(-.9 + (\x-3+\mfunshift)^2 - .1*(\x-3+\mfunshift)^4)}
\diagram[1]{-.5}{6}{-1}{1.7}{1}
\diagramannotatez
\def\mfunshift{0}
\begin{scope}[ultra thick]
\draw[cred] plot[smooth,domain=.5:5.5,samples=100] (\x,{\mfun});
% \only<-3>{
% \draw[draw=none,fill=cred,opacity=.5] (.5,0) -- plot[smooth,domain=.5:3.5,samples=20] (\x,{\mfun}) -- (3.5,0) -- (.5,0) -- cycle;
% }
\def\mwidth{5}
\foreach \nrsteps/\mcolor in {6/cred} {
\def\mstep{\mwidth/(\nrsteps+1)}
\def\mfunshift{.5*\mstep}
\foreach \xx in {0,...,\nrsteps} {
\def\x{.5+ \xx*\mstep}
\pgfmathparse{{\mfun}}
\ifthenelse{\lengthtest{\pgfmathresult cm > 0cm}}{
\def\mcolor{cgreen}
}{}
\draw[thick,draw=\mcolor!60!black,fill=\mcolor,opacity=.5] ({\x},0) rectangle ({\x+\mstep},{\mfun});
\node[include=\mcolor] at ({\x+\mfunshift},{\mfun}) {};
}
}
\node[anchor=north] at (.5,0) {$a$};
\node[anchor=north] at (5.5,0) {$b$};
\node[scale=1.8] at (.9,.5) {+};
\node[scale=1.8] at (5.15,.5) {+};
\node[scale=3] at (3,-.5) {-};
\end{scope}
\end{tikzpicture}
}
\end{center}\vspace{-1.5ex}
\begin{block}{}
The \emph{Riemann sum} is the sum of the area of rectangles above the $x$-axis
(the green ones)
\alert{minus} the sum of the area of the rectangles below the $x$-axis
(the red ones).
\end{block}
\pause
\begin{block}{}
The sample points $x_i$ can be arbitrary from the $i$-th interval:
\begin{itemize}
\item left endpoints, right endpoints or middle of the interval, or
\item at maximum (upper sum), or at minimum (lower sum).
\end{itemize}
\end{block}
\end{frame}