

98/98
\begin{frame}
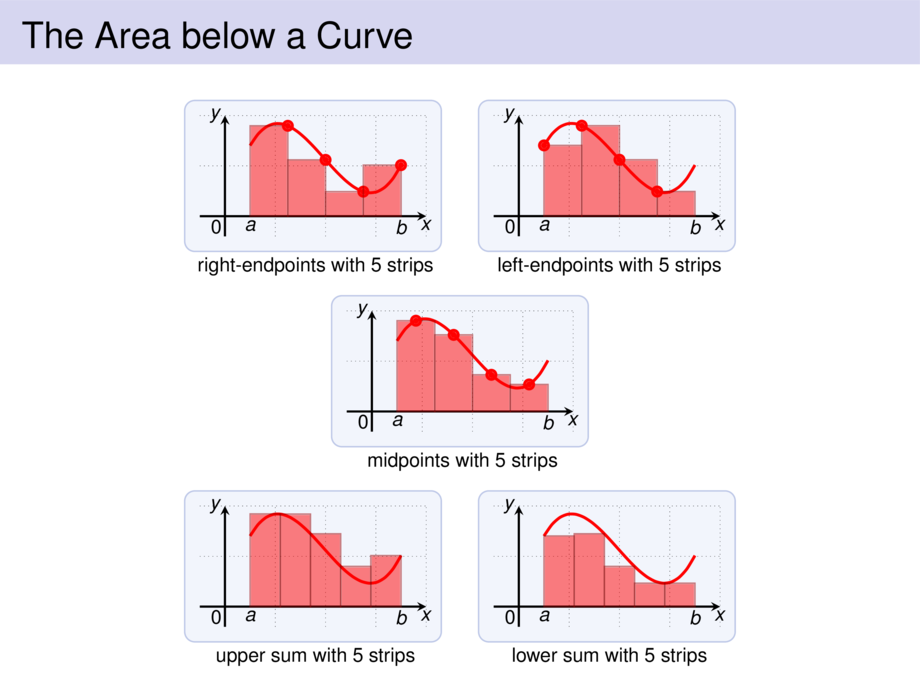
\frametitle{The Area below a Curve}
\begin{center}
\scalebox{.7}{
\begin{tikzpicture}[default]
\def\mfun{(4*(\x+\mfunshift) - 2.6*(\x+\mfunshift)^2 + .44*(\x+\mfunshift)^3)}
{\def\diaborderx{.3cm}
\def\diabordery{.3cm}
\diagram[1]{-.5}{4}{-.4}{2}{1}}
\diagramannotatez
\def\mfunshift{0}
\begin{scope}[ultra thick]
\draw[cred] plot[smooth,domain=.5:3.5,samples=20] (\x,{\mfun});
\def\mwidth{3}
\foreach \nrsteps/\mcolor in {3/cred} {
\def\mstep{\mwidth/(\nrsteps+1)}
\def\mfunshift{\mstep}
\foreach \xx in {0,...,\nrsteps} {
\def\x{.5+ \xx*\mstep}
\draw[thick,draw=\mcolor!60!black,fill=\mcolor,opacity=.5] ({\x},0) rectangle ({\x+\mstep},{\mfun});
\node[include=\mcolor] at ({\x+\mfunshift},{\mfun}) {};
}
}
\node[anchor=north] at (.5,0) {$a$};
\node[anchor=north] at (3.5,0) {$b$};
\node at (1.8,-1) {right-endpoints with $5$ strips};
\end{scope}
\end{tikzpicture}~\hspace{.5cm}~%
\begin{tikzpicture}[default]
\def\mfun{(4*(\x+\mfunshift) - 2.6*(\x+\mfunshift)^2 + .44*(\x+\mfunshift)^3)}
{\def\diaborderx{.3cm}
\def\diabordery{.3cm}
\diagram[1]{-.5}{4}{-.4}{2}{1}}
\diagramannotatez
\def\mfunshift{0}
\begin{scope}[ultra thick]
\draw[cred] plot[smooth,domain=.5:3.5,samples=20] (\x,{\mfun});
\def\mwidth{3}
\foreach \nrsteps/\mcolor in {3/cred} {
\def\mstep{\mwidth/(\nrsteps+1)}
\def\mfunshift{0}
\foreach \xx in {0,...,\nrsteps} {
\def\x{.5+ \xx*\mstep}
\draw[thick,draw=\mcolor!60!black,fill=\mcolor,opacity=.5] ({\x},0) rectangle ({\x+\mstep},{\mfun});
\node[include=\mcolor] at ({\x+\mfunshift},{\mfun}) {};
}
}
\node[anchor=north] at (.5,0) {$a$};
\node[anchor=north] at (3.5,0) {$b$};
\node at (1.8,-1) {left-endpoints with $5$ strips};
\end{scope}
\end{tikzpicture}
}\\[1ex]
\scalebox{.7}{
\begin{tikzpicture}[default]
\def\mfun{(4*(\x+\mfunshift) - 2.6*(\x+\mfunshift)^2 + .44*(\x+\mfunshift)^3)}
{\def\diaborderx{.3cm}
\def\diabordery{.3cm}
\diagram[1]{-.5}{4}{-.4}{2}{1}}
\diagramannotatez
\def\mfunshift{0}
\begin{scope}[ultra thick]
\draw[cred] plot[smooth,domain=.5:3.5,samples=20] (\x,{\mfun});
\def\mwidth{3}
\foreach \nrsteps/\mcolor in {3/cred} {
\def\mstep{\mwidth/(\nrsteps+1)}
\def\mfunshift{\mstep/2}
\foreach \xx in {0,...,\nrsteps} {
\def\x{.5+ \xx*\mstep}
\draw[thick,draw=\mcolor!60!black,fill=\mcolor,opacity=.5] ({\x},0) rectangle ({\x+\mstep},{\mfun});
\node[include=\mcolor] at ({\x+\mfunshift},{\mfun}) {};
}
}
\node[anchor=north] at (.5,0) {$a$};
\node[anchor=north] at (3.5,0) {$b$};
\node at (1.8,-1) {midpoints with $5$ strips};
\end{scope}
\end{tikzpicture}
}\\[1ex]
\scalebox{.7}{
\begin{tikzpicture}[default]
\def\mfun{(4*(\x+\mfunshift) - 2.6*(\x+\mfunshift)^2 + .44*(\x+\mfunshift)^3)}
{\def\diaborderx{.3cm}
\def\diabordery{.3cm}
\diagram[1]{-.5}{4}{-.4}{2}{1}}
\diagramannotatez
\def\mfunshift{0}
\begin{scope}[ultra thick]
\draw[cred] plot[smooth,domain=.5:3.5,samples=20] (\x,{\mfun});
\def\mwidth{3}
\def\mstep{\mwidth/5}
\def\mfunshift{0}
\foreach \xx in {0,...,4} {
\coordinate (height) at (0,0);
\def\x{.5+ \xx*\mstep}
\foreach \xxx in {0,0.01,...,1} {
\gettikzxy{(height)}
\def\mfunshift{\xxx*\mstep}
\pgfmathparse{\mfun}
\ifthenelse{\lengthtest{\pgfmathresult cm > \myy}}{
\coordinate (height) at (0,\pgfmathresult cm);
}{}
}
\draw[thick,draw=cred!60!black,fill=cred,opacity=.5] ({\x},0) rectangle ($({\x+\mstep},0) + (height)$);
}
\node[anchor=north] at (.5,0) {$a$};
\node[anchor=north] at (3.5,0) {$b$};
\node at (1.8,-1) {upper sum with $5$ strips};
\end{scope}
\end{tikzpicture}~\hspace{.5cm}~%
\begin{tikzpicture}[default]
\def\mfun{(4*(\x+\mfunshift) - 2.6*(\x+\mfunshift)^2 + .44*(\x+\mfunshift)^3)}
{\def\diaborderx{.3cm}
\def\diabordery{.3cm}
\diagram[1]{-.5}{4}{-.4}{2}{1}}
\diagramannotatez
\def\mfunshift{0}
\begin{scope}[ultra thick]
\draw[cred] plot[smooth,domain=.5:3.5,samples=20] (\x,{\mfun});
\def\mwidth{3}
\def\mstep{\mwidth/5}
\def\mfunshift{0}
\foreach \xx in {0,...,4} {
\coordinate (height) at (0,5);
\def\x{.5+ \xx*\mstep}
\foreach \xxx in {0,0.01,...,1} {
\gettikzxy{(height)}
\def\mfunshift{\xxx*\mstep}
\pgfmathparse{\mfun}
\ifthenelse{\lengthtest{\pgfmathresult cm < \myy}}{
\coordinate (height) at (0,\pgfmathresult cm);
}{}
}
\draw[thick,draw=cred!60!black,fill=cred,opacity=.5] ({\x},0) rectangle ($({\x+\mstep},0) + (height)$);
}
\node[anchor=north] at (.5,0) {$a$};
\node[anchor=north] at (3.5,0) {$b$};
\node at (1.8,-1) {lower sum with $5$ strips};
\end{scope}
\end{tikzpicture}
}
\end{center}\vspace{-1ex}
\end{frame}