

74/98
\begin{frame}
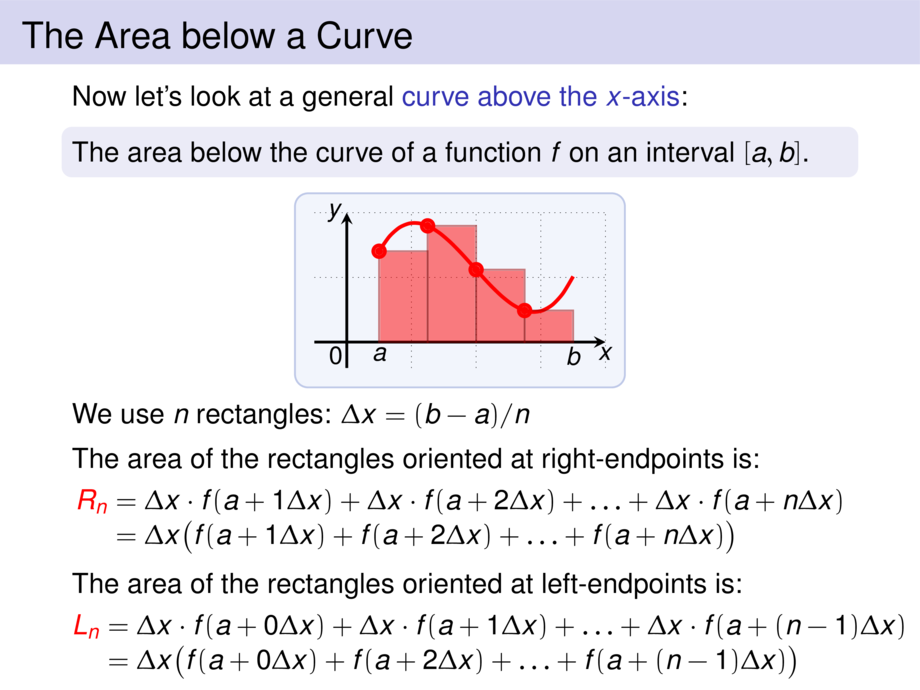
\frametitle{The Area below a Curve}
\begin{block}{}
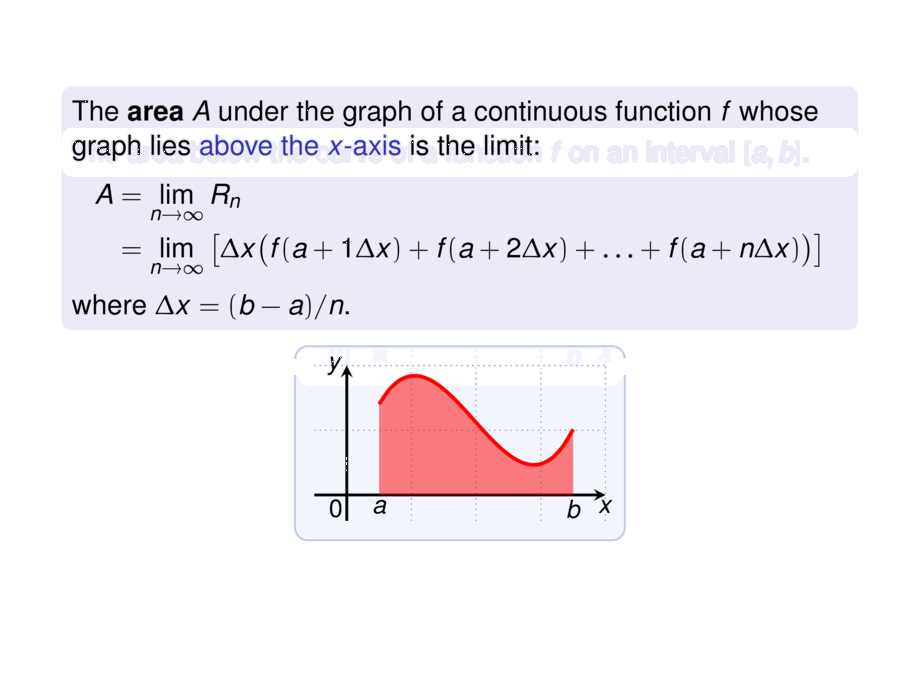
The \emph{area} $A$ under the graph of a continuous function $f$
whose graph lies \structure{above the $x$-axis} is the limit:
% is the limit of the sum of the areas of the approximating rectangles:
\begin{talign}
A &= \lim_{n\to \infty} R_n \\
&= \lim_{n\to \infty} \left[ \Delta x\big(f(a + 1\Delta x) + f(a + 2\Delta x) + \ldots + f(a + n\Delta x)\big) \right]
\end{talign}
where $\Delta x = (b-a)/n$.
\end{block}
\begin{center}
\scalebox{.9}{
\begin{tikzpicture}[default]
\def\mfun{(4*(\x+\mfunshift) - 2.6*(\x+\mfunshift)^2 + .44*(\x+\mfunshift)^3)}
{\def\diaborderx{.3cm}
\def\diabordery{.3cm}
\diagram[1]{-.5}{4}{-.4}{2}{1}}
\diagramannotatez
\def\mfunshift{0}
\begin{scope}[ultra thick]
\draw[cred] plot[smooth,domain=.5:3.5,samples=20] (\x,{\mfun});
\draw[draw=none,fill=cred,opacity=.5] (.5,0) -- plot[smooth,domain=.5:3.5,samples=20] (\x,{\mfun}) -- (3.5,0) -- (.5,0) -- cycle;
\node[anchor=north] at (.5,0) {$a$};
\node[anchor=north] at (3.5,0) {$b$};
\end{scope}
\end{tikzpicture}
}
\end{center}\vspace{-1ex}
\pause
\begin{block}{}
For continuous $f$ this limit always exists, and is the same as
\begin{talign}
\lim_{n\to \infty} L_n = \lim_{n\to \infty} \left[ \Delta x\big(f(a + 0\Delta x) + \ldots + f(a + (n-1)\Delta x)\big) \right]
\end{talign}
\end{block}
\vspace{10cm}
\end{frame}