

56/98
\begin{frame}
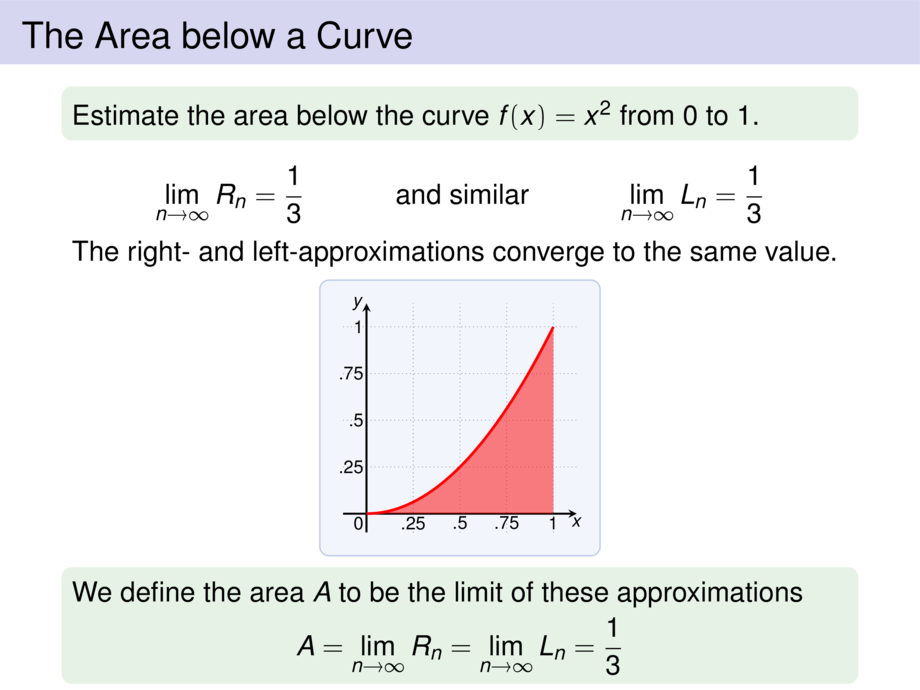
\frametitle{The Area below a Curve}
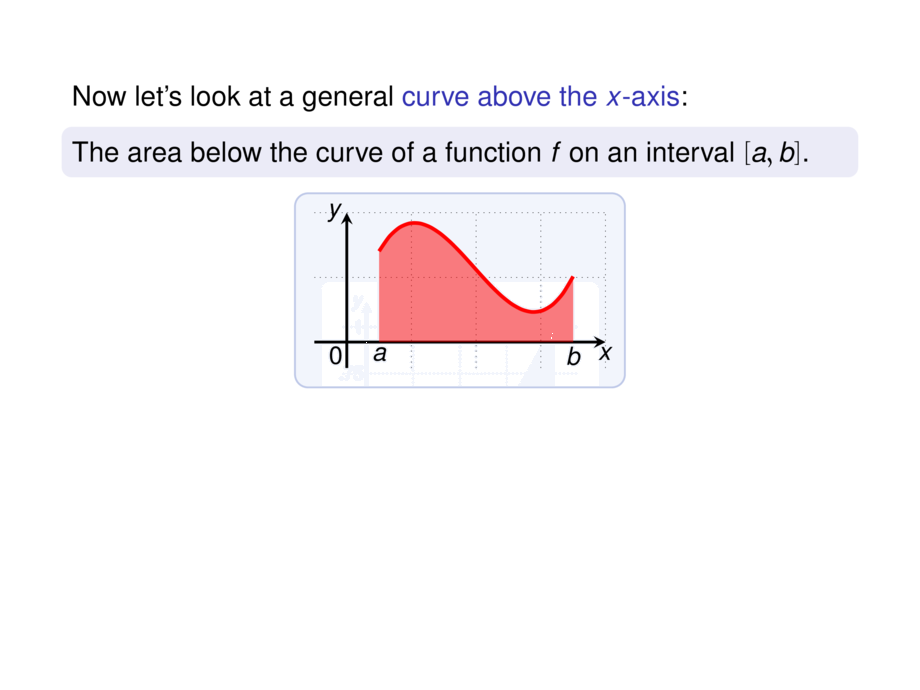
Now let's look at a general \structure{curve above the $x$-axis}:
\begin{block}{}
The area below the curve of a function $f$ on an interval $[a,b]$.
\end{block}
\begin{center}
\scalebox{.9}{
\begin{tikzpicture}[default]
\def\mfun{(4*(\x+\mfunshift) - 2.6*(\x+\mfunshift)^2 + .44*(\x+\mfunshift)^3)}
{\def\diaborderx{.3cm}
\def\diabordery{.3cm}
\diagram[1]{-.5}{4}{-.4}{2}{1}}
\diagramannotatez
\def\mfunshift{0}
\begin{scope}[ultra thick]
\draw[cred] plot[smooth,domain=.5:3.5,samples=20] (\x,{\mfun});
\only<-3>{
\draw[draw=none,fill=cred,opacity=.5] (.5,0) -- plot[smooth,domain=.5:3.5,samples=20] (\x,{\mfun}) -- (3.5,0) -- (.5,0) -- cycle;
}
\only<4-13>{
\def\mwidth{3}
\foreach \nrsteps/\mcolor in {3/cred} {
\def\mstep{\mwidth/(\nrsteps+1)}
\def\mfunshift{\mstep}
\foreach \xx in {0,...,\nrsteps} {
\def\x{.5+ \xx*\mstep}
\draw[thick,draw=\mcolor!60!black,fill=\mcolor,opacity=.5] ({\x},0) rectangle ({\x+\mstep},{\mfun});
\node[include=\mcolor] at ({\x+\mfunshift},{\mfun}) {};
}
}
}
\only<14->{
\def\mwidth{3}
\foreach \nrsteps/\mcolor in {3/cred} {
\def\mstep{\mwidth/(\nrsteps+1)}
\def\mfunshift{0}
\foreach \xx in {0,...,\nrsteps} {
\def\x{.5+ \xx*\mstep}
\draw[thick,draw=\mcolor!60!black,fill=\mcolor,opacity=.5] ({\x},0) rectangle ({\x+\mstep},{\mfun});
\node[include=\mcolor] at ({\x+\mfunshift},{\mfun}) {};
}
}
}
\node[anchor=north] at (.5,0) {$a$};
\node[anchor=north] at (3.5,0) {$b$};
\end{scope}
\end{tikzpicture}
}
\end{center}\vspace{-1ex}
\pause
We use $n$ rectangles: \mpause[6]{$\Delta x = \pause (b-a)/n$}
\only<-7>{\begin{itemize}
\item the width of the interval is $b-a$
\pause
\item the width of each strip is $\Delta x = \pause (b-a)/n$
\pause
\item the interval for the $i$-th strip is \pause $I_i = [a + (i-1)\Delta x,\;a+ i\Delta x]$
\end{itemize}
}
\pause\pause\pause\pause\pause\pause\medskip
The area of the rectangles oriented at right-endpoints is:\vspace{-.5ex}
\begin{talign}
\alert{R_n} &= \mpause[1]{ \Delta x\cdot f(a + 1\Delta x) }
\mpause{ + \Delta x\cdot f(a + 2\Delta x) }
\mpause{ +\ldots+ \Delta x\cdot f(a + n\Delta x) } \\[-.5ex]
&\mpause{= \Delta x\big(f(a + 1\Delta x) + f(a + 2\Delta x) + \ldots + f(a + n\Delta x)\big)}
\end{talign}
\pause\pause\pause\pause\pause
The area of the rectangles oriented at left-endpoints is:\vspace{-.5ex}
\begin{talign}
\alert{L_n} &= \mpause[1]{ \Delta x\cdot f(a + 0\Delta x) }
\mpause{ + \Delta x\cdot f(a + 1\Delta x) }
\mpause{ +\ldots+ \Delta x\cdot f(a + (n-1)\Delta x) } \\[-.5ex]
&\mpause{= \Delta x\big(f(a + 0\Delta x) + f(a + 2\Delta x) + \ldots + f(a + (n-1)\Delta x)\big)}
\end{talign}
\vspace{10cm}
\end{frame}