

35/98
\begin{frame}
\frametitle{The Area below a Curve}
\begin{exampleblock}{}
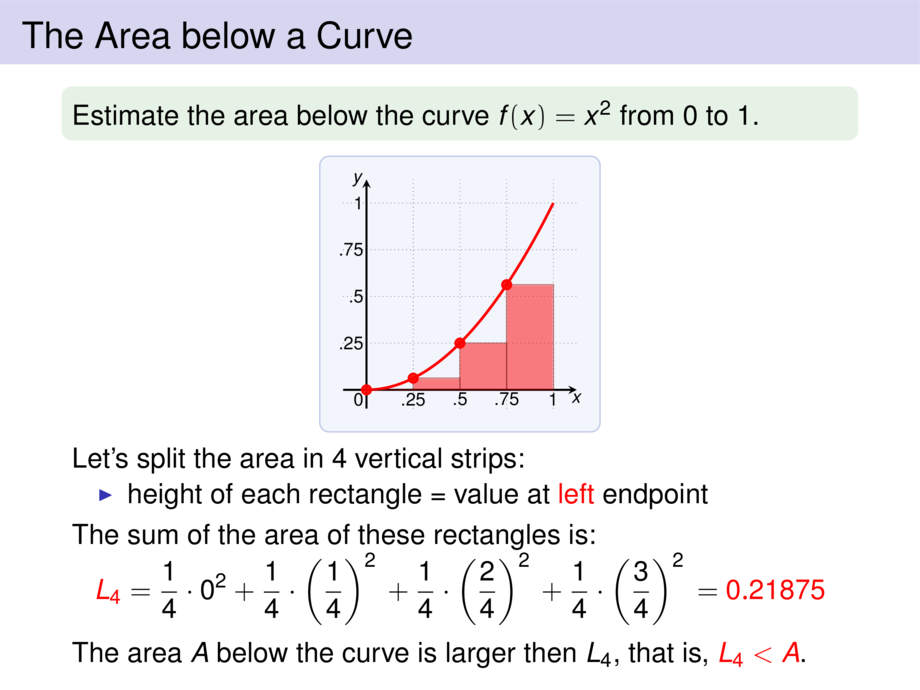
Estimate the area below the curve $f(x) = x^2$ from $0$ to $1$.
\end{exampleblock}
\medskip
\begin{minipage}{.49\textwidth}
\begin{center}
\scalebox{.65}{
\begin{tikzpicture}[default]
\def\mfun{(4*((\x+\mfunshift)/4)^2)}
\diagram[1]{-.5}{4.5}{-.4}{4.5}{1}
\diagramannotatez
\diagramannotatexx{1/.25,2/.5,3/.75,4/1}
\diagramannotateyy{1/.25,2/.5,3/.75,4/1}
\def\mfunshift{0}
\begin{scope}[ultra thick]
\draw[cred] plot[smooth,domain=0:4,samples=20] (\x,{\mfun});
\def\mwidth{4}
\setcounter{slide}{1}
\foreach \nrsteps/\mcolor in {3/cred,7/cred,19/cred} {
\setcounter{roundcounter}{\arabic{slide}}
\def\mstep{\mwidth/(\nrsteps+1)}
\def\mfunshift{0}
\foreach \xx in {0,...,\nrsteps} {
\def\x{\xx*\mstep}
\setcounter{tmpcount}{\arabic{roundcounter}}
\addtocounter{tmpcount}{\nrsteps}
\onslide<\arabic{slide}>{
\draw[thick,draw=\mcolor!60!black,fill=\mcolor,opacity=.5] ({\x},0) rectangle ({\x+\mstep},{\mfun});
\node[include=\mcolor] at ({\x+\mfunshift},{\mfun}) {};
}
}
\addtocounter{slide}{1}
}
\end{scope}
\end{tikzpicture}
}
\end{center}
\end{minipage}~
\begin{minipage}{.49\textwidth}
\begin{center}
\scalebox{.65}{
\begin{tikzpicture}[default]
\def\mfun{(4*((\x+\mfunshift)/4)^2)}
\diagram[1]{-.5}{4.5}{-.4}{4.5}{1}
\diagramannotatez
\diagramannotatexx{1/.25,2/.5,3/.75,4/1}
\diagramannotateyy{1/.25,2/.5,3/.75,4/1}
\def\mfunshift{0}
\begin{scope}[ultra thick]
\draw[cred] plot[smooth,domain=0:4,samples=20] (\x,{\mfun});
\def\mwidth{4}
\setcounter{slide}{1}
\foreach \nrsteps/\mcolor in {3/cred,7/cred,19/cred} {
\setcounter{roundcounter}{\arabic{slide}}
\def\mstep{\mwidth/(\nrsteps+1)}
\def\mfunshift{\mstep}
\foreach \xx in {0,...,\nrsteps} {
\def\x{\xx*\mstep}
\setcounter{tmpcount}{\arabic{roundcounter}}
\addtocounter{tmpcount}{\nrsteps}
\onslide<\arabic{slide}>{
\draw[thick,draw=\mcolor!60!black,fill=\mcolor,opacity=.5] ({\x},0) rectangle ({\x+\mstep},{\mfun});
\node[include=\mcolor] at ({\x+\mfunshift},{\mfun}) {};
}
}
\addtocounter{slide}{1}
}
\end{scope}
\end{tikzpicture}
}
\end{center}
\end{minipage}
\begin{talign}
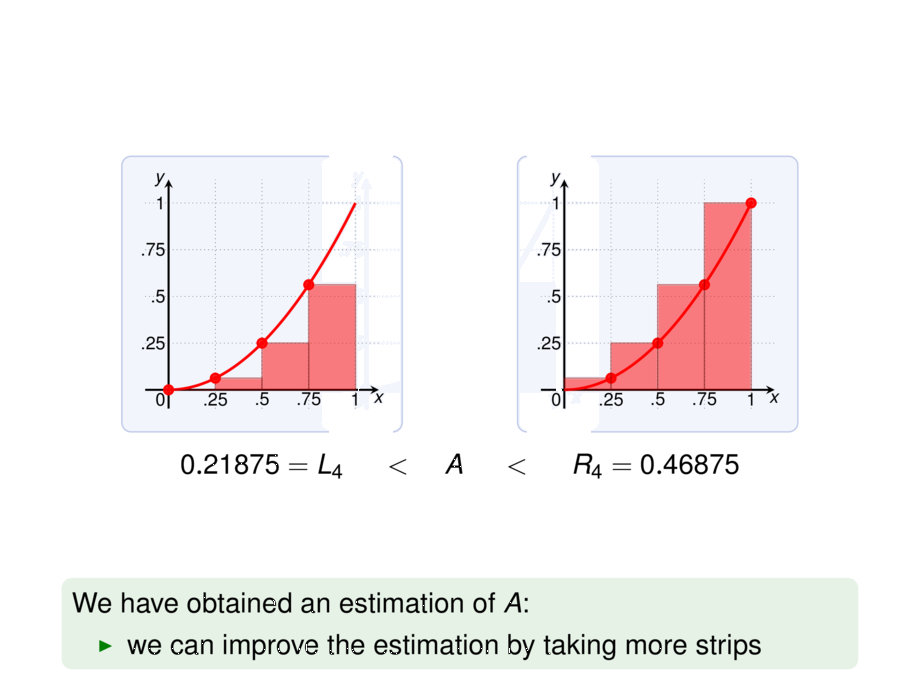
0.21875 = L_4 \hspace{.5cm}<\hspace{.5cm} &A \hspace{.5cm}<\hspace{.5cm} R_4 = 0.46875
\\
\mpause[1]{
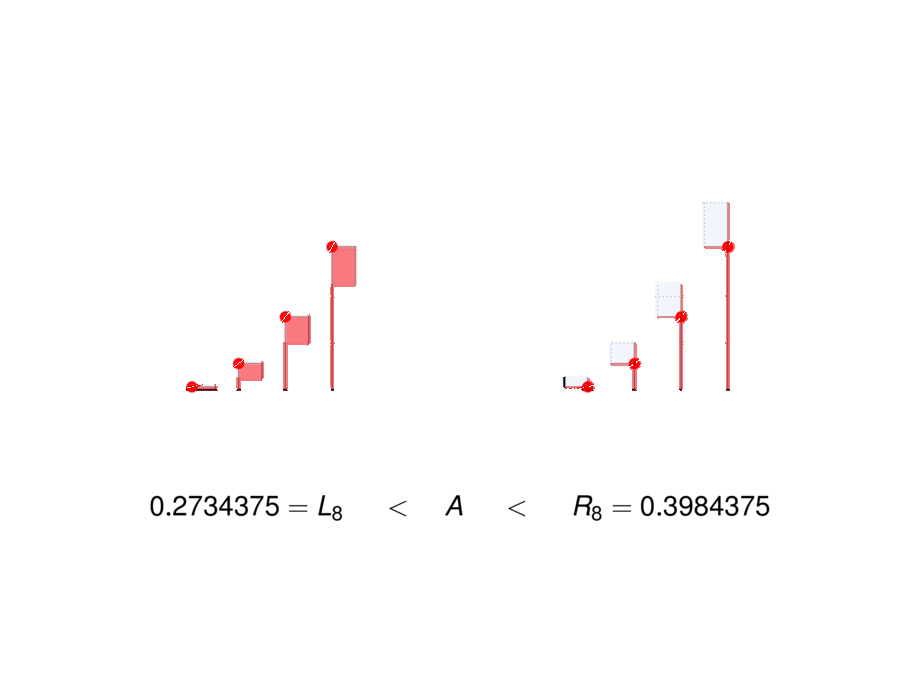
0.2734375 = L_8 \hspace{.5cm}<\hspace{.5cm} &A \hspace{.5cm}<\hspace{.5cm} R_8 = 0.3984375
}\\
\mpause{
0.3087500 = L_{20} \hspace{.5cm}<\hspace{.5cm} &A \hspace{.5cm}<\hspace{.5cm} R_{20} = 0.3587500
}
% \mpause{
% 0.3234000 = L_{50} \hspace{.5cm}<\hspace{.5cm} &A \hspace{.5cm}<\hspace{.5cm} R_{50} = 0.3434000
% }
% \mpause{
% 0.3283500 = L_{100} \hspace{.5cm}<\hspace{.5cm} &A \hspace{.5cm}<\hspace{.5cm} R_{100} = 0.3383500
% }
\end{talign}\vspace{-3ex}
\begin{exampleblock}{}
We have obtained an estimation of $A$:
\begin{itemize}
\item we can improve the estimation by taking more strips
\end{itemize}
\end{exampleblock}
\vspace{10cm}
\end{frame}