


32/98
\begin{frame}
\frametitle{The Area below a Curve}
\begin{exampleblock}{}
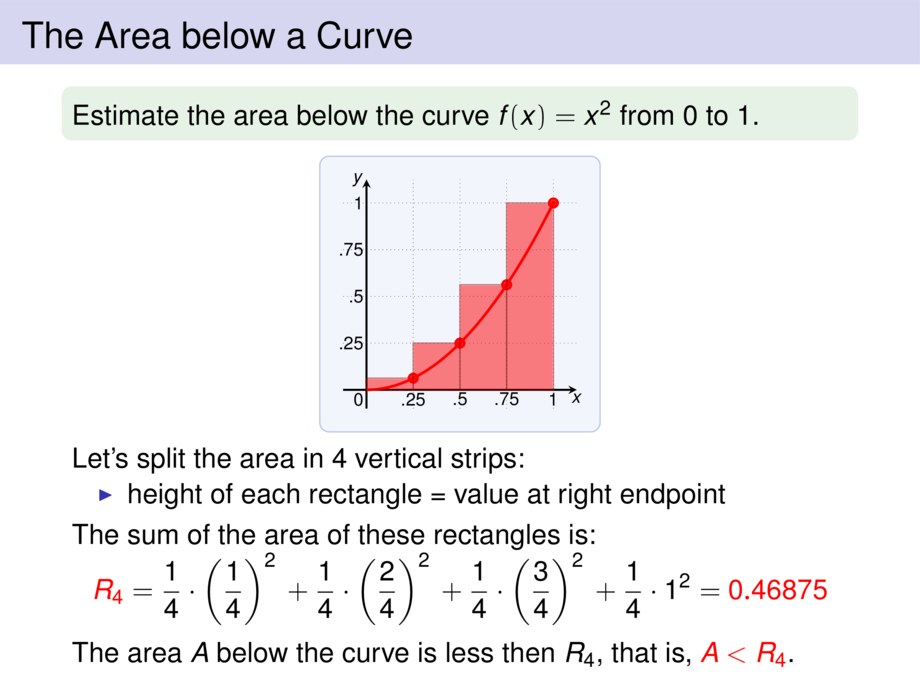
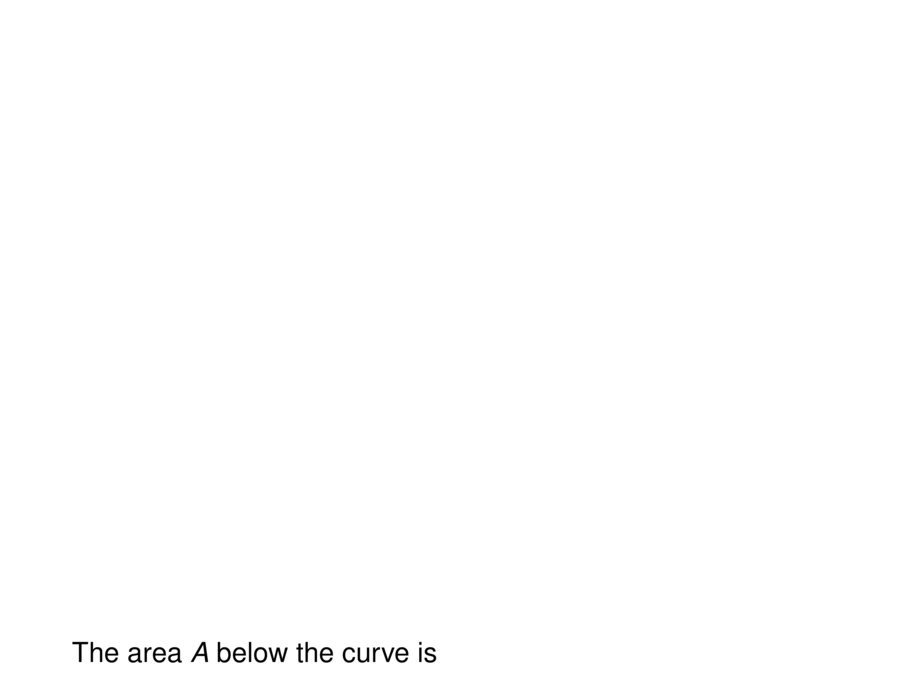
Estimate the area below the curve $f(x) = x^2$ from $0$ to $1$.
\end{exampleblock}
\begin{center}
\scalebox{.65}{
\begin{tikzpicture}[default]
\def\mfun{(4*((\x+\mfunshift)/4)^2)}
\diagram[1]{-.5}{4.5}{-.4}{4.5}{1}
\diagramannotatez
\diagramannotatexx{1/.25,2/.5,3/.75,4/1}
\diagramannotateyy{1/.25,2/.5,3/.75,4/1}
\def\mfunshift{0}
\begin{scope}[ultra thick]
\draw[cred] plot[smooth,domain=0:4,samples=20] (\x,{\mfun});
\def\mwidth{4}
\setcounter{slide}{2}
\foreach \nrsteps/\mcolor in {3/cred} {
\setcounter{roundcounter}{\arabic{slide}}
\def\mstep{\mwidth/(\nrsteps+1)}
\def\mfunshift{0}
\foreach \xx in {0,...,\nrsteps} {
\def\x{\xx*\mstep}
\setcounter{tmpcount}{\arabic{roundcounter}}
\addtocounter{tmpcount}{\nrsteps}
\onslide<\arabic{slide}->{
\draw[thick,draw=\mcolor!60!black,fill=\mcolor,opacity=.5] ({\x},0) rectangle ({\x+\mstep},{\mfun});
\node[include=\mcolor] at ({\x+\mfunshift},{\mfun}) {};
}
\addtocounter{slide}{1}
}
}
\end{scope}
\end{tikzpicture}
}
\end{center}
\vspace{-1ex}
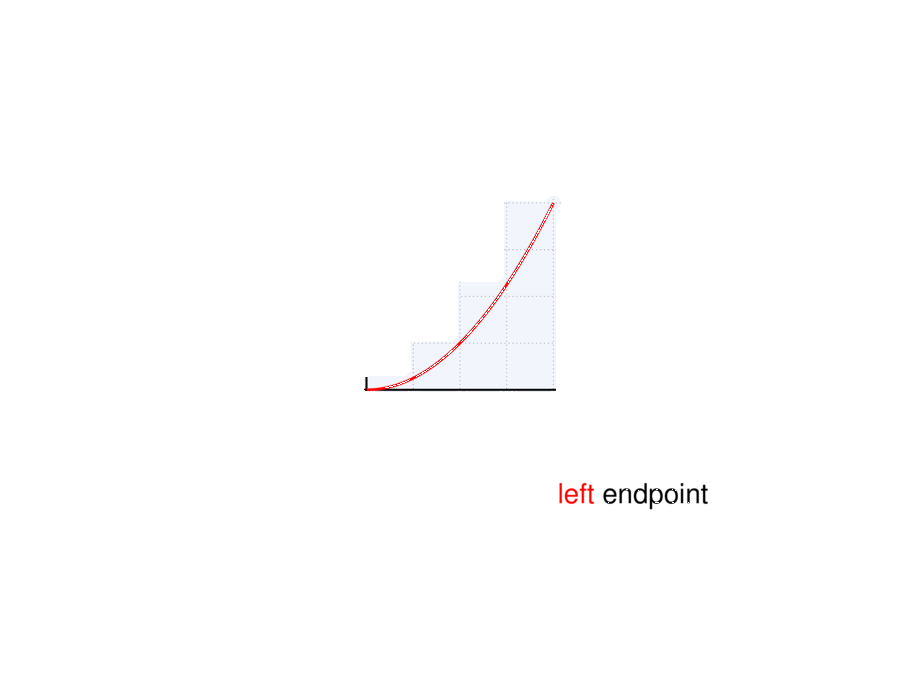
Let's split the area in $4$ vertical strips:
\begin{itemize}
\item height of each rectangle = value at \alert{left} endpoint
\end{itemize}
\pause\pause\pause\pause\pause\smallskip
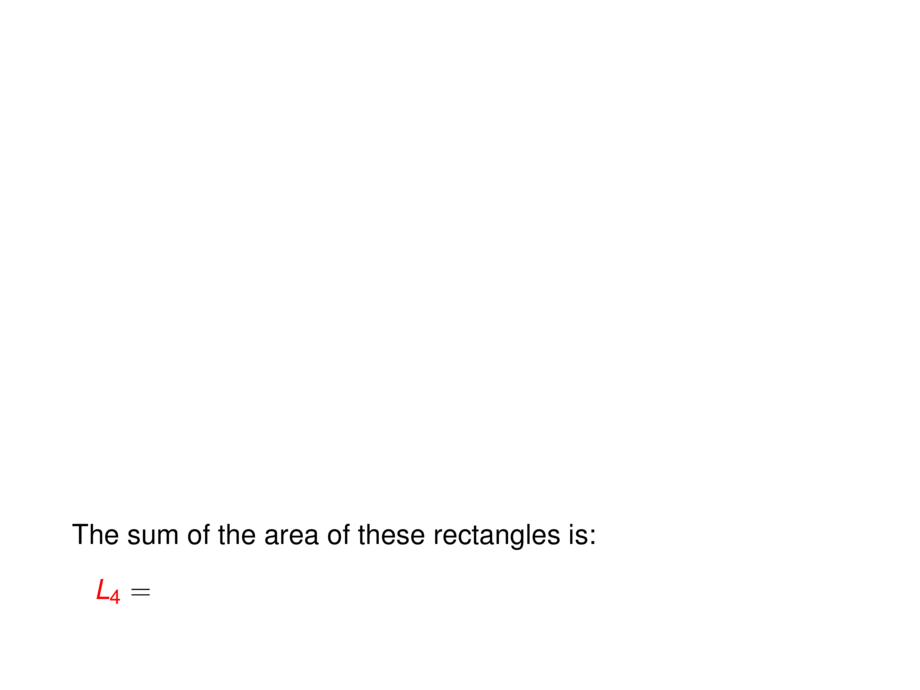
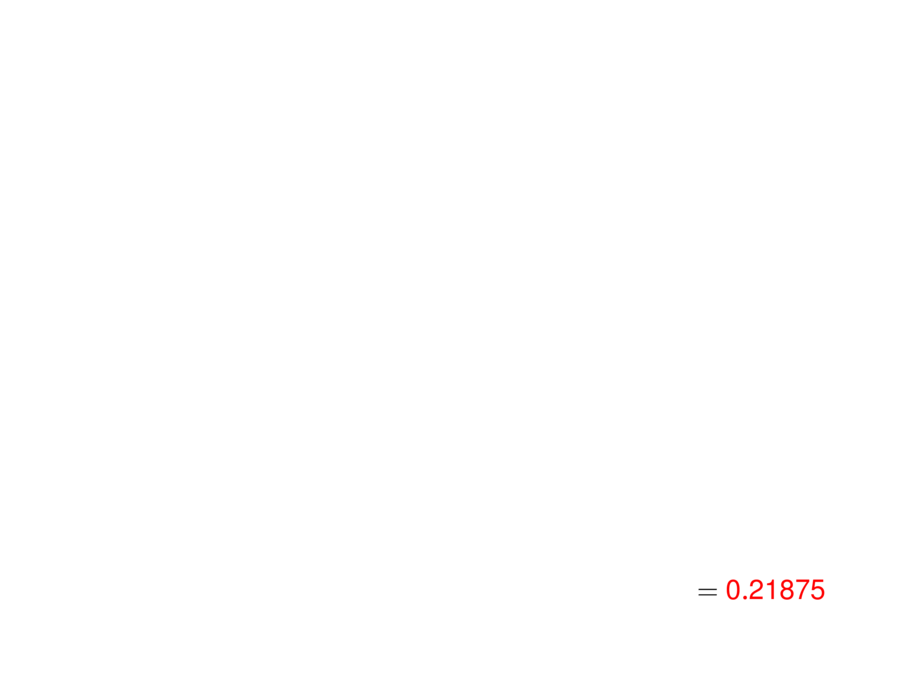
The sum of the area of these rectangles is:\vspace{-1ex}
\begin{talign}
&\alert{L_4} = \mpause[1]{ \frac{1}{4} \cdot 0^2 }
\mpause{ + \frac{1}{4} \cdot \left(\frac{1}{4}\right)^2 }
\mpause{ + \frac{1}{4} \cdot \left(\frac{2}{4}\right)^2 }
\mpause{ + \frac{1}{4} \cdot \left(\frac{3}{4}\right)^2 }
\mpause{ = \alert{0.21875}}
\end{talign}
\pause\pause\pause\pause\pause\pause
The area $A$ below the curve is \pause larger then $L_4$, that is, \alert{$L_4 < A$}.
\vspace{10cm}
\end{frame}