

3/98
\begin{frame}
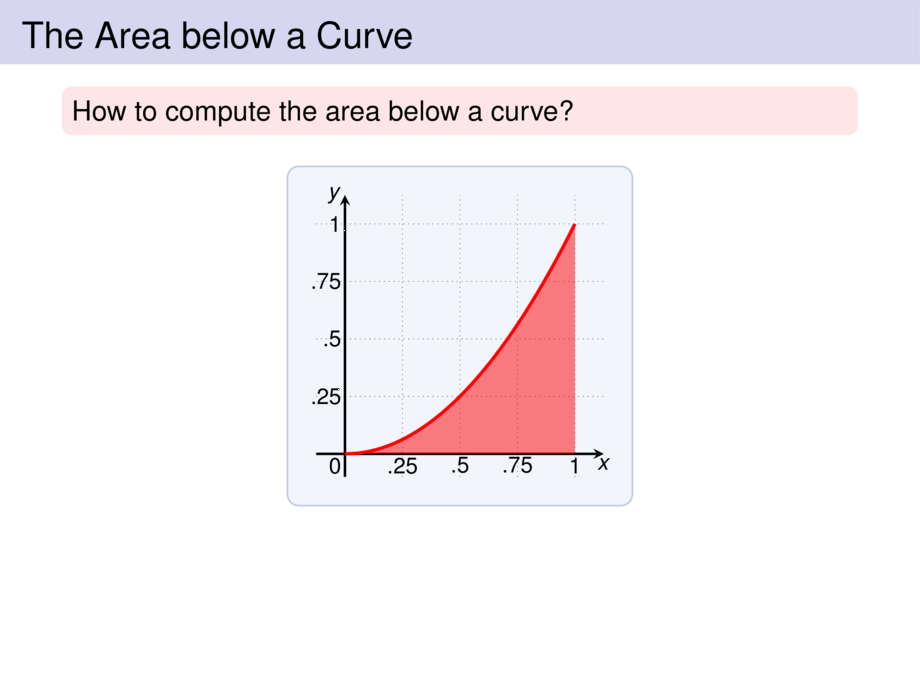
\frametitle{The Area below a Curve}
\begin{alertblock}{}
How to compute the area below a curve?
\end{alertblock}
\medskip
\begin{center}
\scalebox{.8}{
\begin{tikzpicture}[default]
\def\mfun{(4*((\x+\mfunshift)/4)^2)}
\diagram[1]{-.5}{4.5}{-.4}{4.5}{1}
\diagramannotatez
\diagramannotatexx{1/.25,2/.5,3/.75,4/1}
\diagramannotateyy{1/.25,2/.5,3/.75,4/1}
\def\mfunshift{0}
\begin{scope}[ultra thick]
\draw[cred] plot[smooth,domain=0:4,samples=20] (\x,{\mfun});
\draw[draw=none,fill=cred,opacity=.5] (.5,0) -- plot[smooth,domain=0:4,samples=20] (\x,{\mfun}) -- (4,0) -- (0,0) -- cycle;
\end{scope}
\end{tikzpicture}
}
\end{center}
\pause
\begin{exampleblock}{}
Idea:
\begin{itemize}
\pause
\item divide the area in vertical strips of equal width
\pause
\item approximate the area using rectangles
\end{itemize}
\end{exampleblock}
\vspace{10cm}
\end{frame}