

63/121
\begin{frame}
\frametitle{Curve Sketching}
\begin{exampleblock}{}
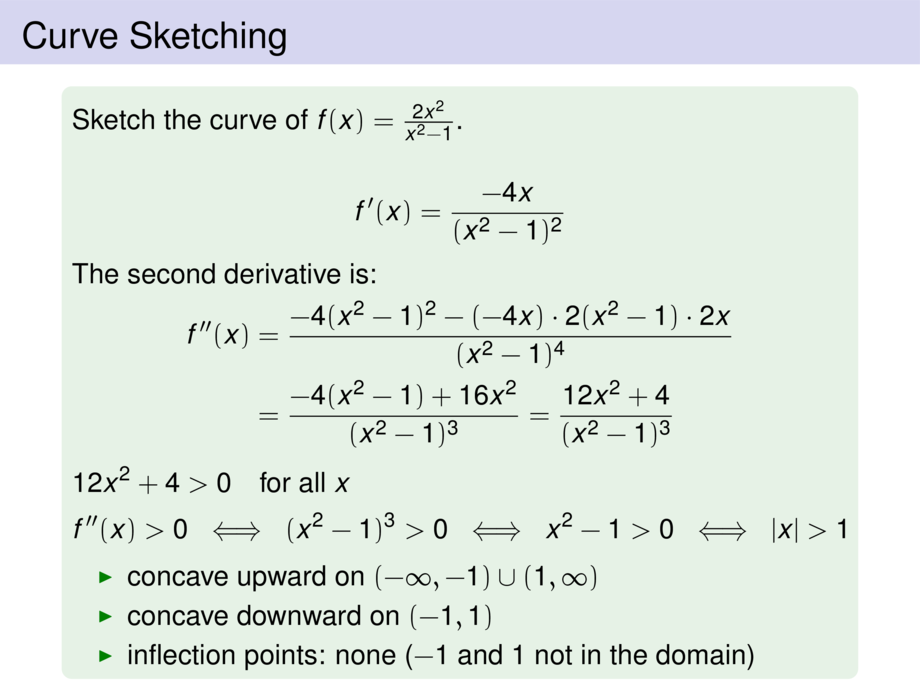
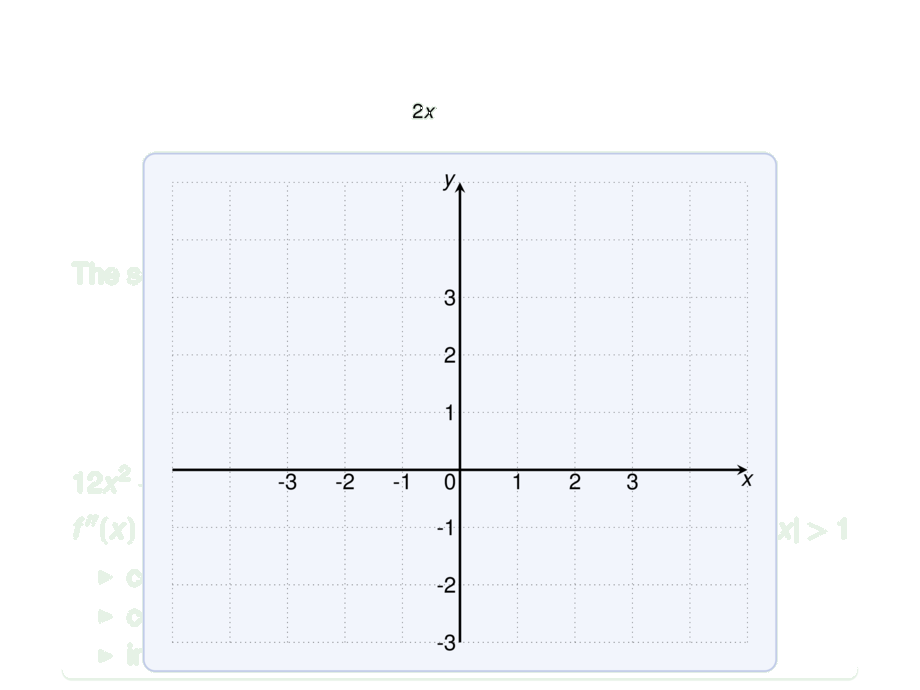
Sketch the curve of $f(x) = \frac{2x^2}{x^2-1}$.\vspace{-1ex}
\begin{center}
\scalebox{.8}{
\begin{tikzpicture}[default,baseline=1cm]
\diagram{-5}{5}{-3}{5}{1}
\diagramannotatey{-3,-2,-1,1,2,3}
\diagramannotatex{-3,-2,-1,1,2,3}
\diagramannotatez
\pause
\node[include=cgreen] at (0,0) {};
\pause
\draw[dashed,gray] (-1,-3) -- (-1,5);
\draw[dashed,gray] (1,-3) -- (1,5);
\pause
\draw[dashed,gray] (-5,2) -- (5,2);
\begin{scope}[ultra thick]
\pause
\draw[cgreen,ultra thick] plot[smooth,domain=-5:-1.3,samples=200] function{2*x**2/(x**2 - 1)};
\pause
\draw[cgreen,ultra thick] plot[smooth,domain=-0.77:0,samples=200] function{2*x**2/(x**2 - 1)};
\pause
\draw[cgreen,ultra thick] plot[smooth,domain=0:0.77,samples=200] function{2*x**2/(x**2 - 1)};
\pause
\draw[cgreen,ultra thick] plot[smooth,domain=1.3:5,samples=200] function{2*x**2/(x**2 - 1)};
\end{scope}
\end{tikzpicture}
}
\end{center}
\end{exampleblock}
\end{frame}