


70/158
\begin{frame}
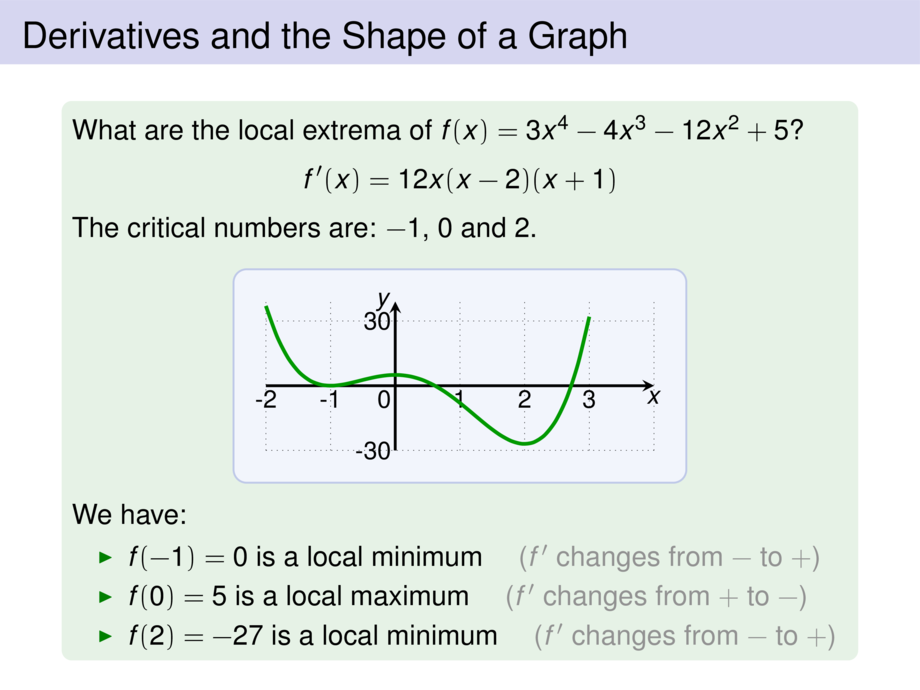
\frametitle{Derivatives and the Shape of a Graph}
\begin{exampleblock}{}
What are the local extrema of
\begin{talign}
f(x) &= x + 2\sin x && \text{$0 \le x \le 2\pi$ \quad ?}
\end{talign}\vspace{-.5ex}
\pause
We have
\begin{talign}
&f'(x) = \mpause[1]{1 + 2\cos x} \\[-1ex]
&\mpause[2]{f'(x) = 0 \;\iff\;}
\mpause[3]{ \cos x = -\frac{1}{2} \;\iff\;}
\mpause[4]{ x = \frac{2\pi}{3} \text{ or } x = \frac{4\pi}{3} }
\end{talign}
\pause\pause\pause\pause\pause
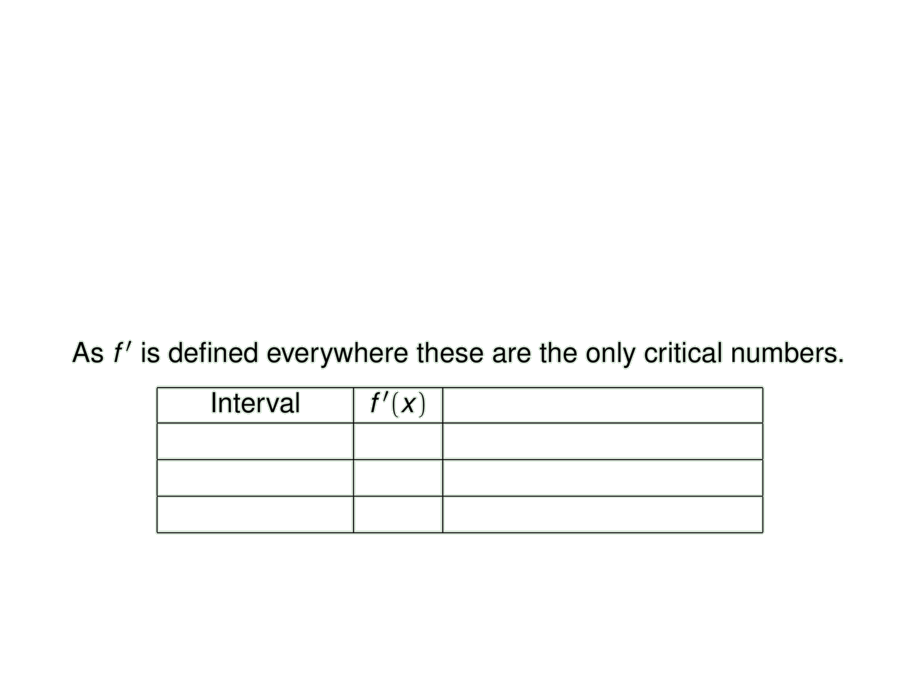
As $f'$ is defined everywhere these are the only critical numbers.
\begin{overlayarea}{\textwidth}{2.6cm}
\only<-21>{
\begin{center}\vspace{-.5ex}
\begin{tabular}{|c|c|l|}
\hline
Interval & $f'(x)$ & \\
\hline
\mpause[1]{ $0 < x < \frac{2\pi}{3}$ } & \mpause[4]{+} & \mpause{ increasing on $(0,\frac{2\pi}{3})$ } \\
\hline
\mpause[2]{ $\frac{2\pi}{3} < x < \frac{4\pi}{3}$ } & \mpause[6]{-} & \mpause{ decreasing on $(\frac{2\pi}{3},\frac{4\pi}{3})$ } \\
\hline
\mpause[3]{ $\frac{4\pi}{3} < x < 2\pi$ } & \mpause[8]{+} & \mpause{ increasing on $(\frac{4\pi}{3},2\pi)$ } \\
\hline
\end{tabular}
\end{center}
}
\only<22>{
\begin{center}\vspace{-1ex}
\scalebox{.9}{
\begin{tikzpicture}[default,baseline=1cm,yscale=.4]
\diagram{-.5}{7}{-.2}{6}{1}
\diagramannotatez
\diagramannotatey{2,4}
\diagramannotatexx{pi/$\pi$,2*pi/$2\pi$}
\begin{scope}[ultra thick]
\draw[cgreen] plot[smooth,domain=0:2*pi,samples=30] function{x + 2*sin(x)};
\end{scope}
\end{tikzpicture}\vspace{-1ex}
}
\end{center}
}
\end{overlayarea}
\pause[17]
As a consequence:
\begin{itemize}
\pause
\item $f(\frac{2\pi}{3}) = \frac{2\pi}{3} + \sqrt{3}$ is \pause a local maximum \textcolor{gray}{($f'$ from $+$ to $-$)}
\pause
\item $f(\frac{4\pi}{3}) = \frac{4\pi}{3} - \sqrt{3}$ is \pause a local minimum \textcolor{gray}{($f'$ from $-$ to $+$)}
\end{itemize}
\end{exampleblock}
\end{frame}