


29/158
\begin{frame}
\frametitle{Derivatives and the Shape of a Graph}
\begin{block}{}
If $f'(x) > 0$ on an interval, then $f$ is increasing on that interval.
\pause\medskip
If $f'(x) < 0$ on an interval, then $f$ is decreasing on that interval.
\end{block}
\pause
\begin{exampleblock}{}
Where is $f(x) = 3x^4 - 4x^3 -12x^2 + 5$ increasing/decreasing?
\pause
\begin{talign}
f'(x) = \mpause[1]{12x^3 - 12x^2 - 24x}
\mpause[2]{= 12x(x-2)(x+1)}
\end{talign}
\pause\pause\pause
{\small
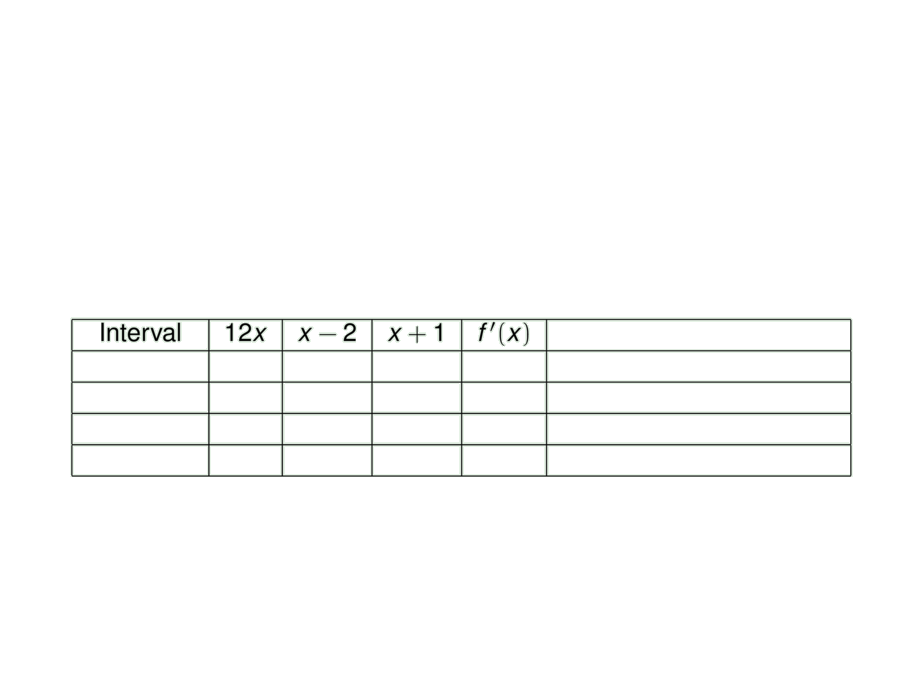
\begin{tabular}{|c|c|c|c|c|l|}
\hline
Interval & $12x$ & $x-2$ & $x+1$ & $f'(x)$ & \\
\hline
\mpause[1]{x < -1} & \mpause[5]{-} & \mpause{-} & \mpause{-} & \mpause{-} & \mpause{decreasing on $(-\infty,-1)$} \\
\hline
\mpause[2]{-1 < x < 0} & \mpause[10]{-} & \mpause{-} & \mpause{+} & \mpause{+} & \mpause{increasing on $(-1,0)$} \\
\hline
\mpause[3]{0 < x < 2} & \mpause[15]{+} & \mpause{-} & \mpause{+} & \mpause{-} & \mpause{decreasing on $(0,2)$} \\
\hline
\mpause[4]{2 < x} & \mpause[20]{+} & \mpause{+} & \mpause{+} & \mpause{+} & \mpause{increasing on $(2,\infty)$} \\
\hline
\end{tabular}
}
\pause[31]
\begin{center}\vspace{-1ex}
\scalebox{.8}{
\begin{tikzpicture}[default,baseline=1cm]
\diagram{-2}{4}{-1}{1.3}{1}
\diagramannotatez
\diagramannotateyy{-1/-30,1/30}
\diagramannotatex{-2,-1,1,2,3}
\begin{scope}[ultra thick]
\draw[cgreen] plot[smooth,domain=-2:3,samples=30] function{(3*x**4 - 4*x**3 - 12*x**2 + 5)/30};
\end{scope}
\end{tikzpicture}\vspace{-1ex}
}
\end{center}
\end{exampleblock}
\end{frame}