

6/209
\begin{frame}
\frametitle{Maximum and Minimum Values}
\vspace{-1ex}
\begin{center}
\scalebox{.7}{
\begin{tikzpicture}[default,baseline=1cm]
\diagram{-.5}{10}{-.5}{3}{1}
\diagramannotatey{1,2}
\diagramannotatex{1,2,3,4,5,6,7,8,9}
\diagramannotatez
\begin{scope}[ultra thick]
%\draw[cgreen,ultra thick] plot[smooth,domain=-3:6,samples=200] function{sqrt(x+3)} node[below,xshift=-2mm,yshift=-2mm] {$\sqrt{x+3}$};
\begin{scope}[cgreen,ultra thick]
\draw (.2,3) to[out=-45,in=180] (2,1.5) to[out=0,in=180] (4,2.5) to[out=0,in=180] (7,.5) to[out=0,in=-120] (9,3);
\end{scope}
\mpause[3]{
\node[include=cred] (a) at (7,.51) {};
\node[] (b) at ($(a)+(0,2)$) {absolute minimum};
\mpause[11]{ \node[] at ($(a)+(0,2.4)$) {local minimum \&}; }
\draw[->,shorten >= 2mm] (b) -- (a);
}
\mpause[9]{
\node[include=cred] (a) at (4,2.5) {};
\node[] (b) at ($(a)+(0,-1.5)$) {local maximum};
\draw[->,shorten >= 2mm] (b) -- (a);
}
\mpause[10]{
\node[include=cred] (a) at (2,1.5) {};
\node[] (b) at ($(a)+(0,-1)$) {local minimum};
\draw[->,shorten >= 2mm] (b) -- (a);
}
\end{scope}
\end{tikzpicture}
}
\end{center}\vspace{-1ex}
\begin{block}{}
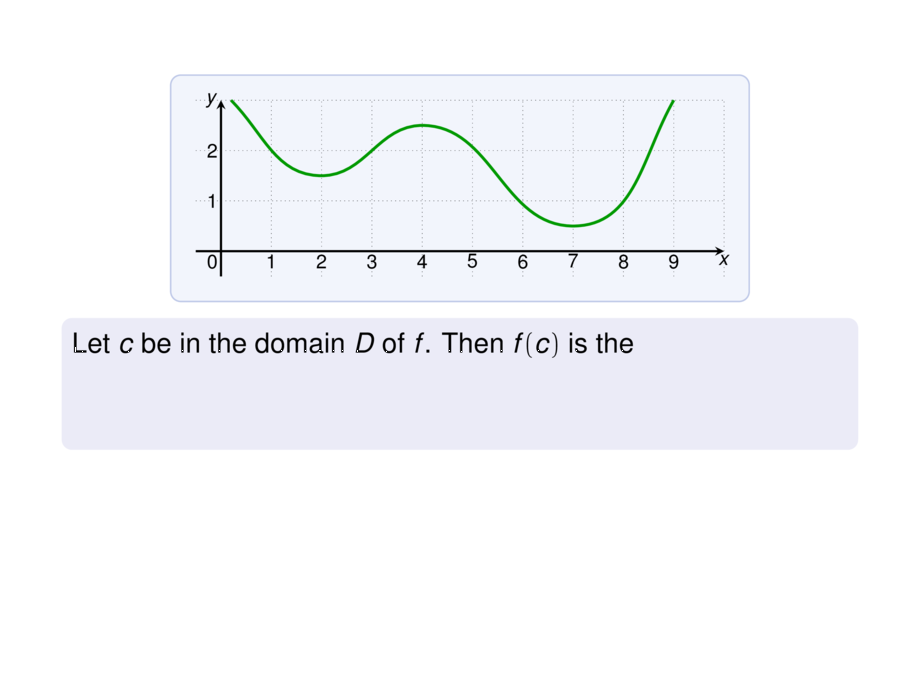
Let $c$ be in the domain $D$ of $f$. Then $f(c)$ is the
\begin{itemize}
\pause
\item \emph{absolute maximum} value of $f$ if $f(c) \ge f(x)$ for all $x$ in $D$
\pause
\item \emph{absolute minimum} value of $f$ if $f(c) \le f(x)$ for all $x$ in $D$
\end{itemize}
\end{block}
\pause\pause
Often called \emph{global maximum} or \emph{global minimum}.\\
\pause
Minima and maxima are called \emph{extreme values} of $f$.
\pause\medskip
\begin{block}{}
The number $f(c)$ is a
\begin{itemize}
\pause
\item \emph{local maximum} value of $f$ if $f(c) \ge f(x)$ when $x$ is near $c$
\pause
\item \emph{local minimum} value of $f$ if $f(c) \le f(x)$ when $x$ is near $c$
\end{itemize}
\end{block}
\vspace{10cm}
\end{frame}