

32/142
\begin{frame}
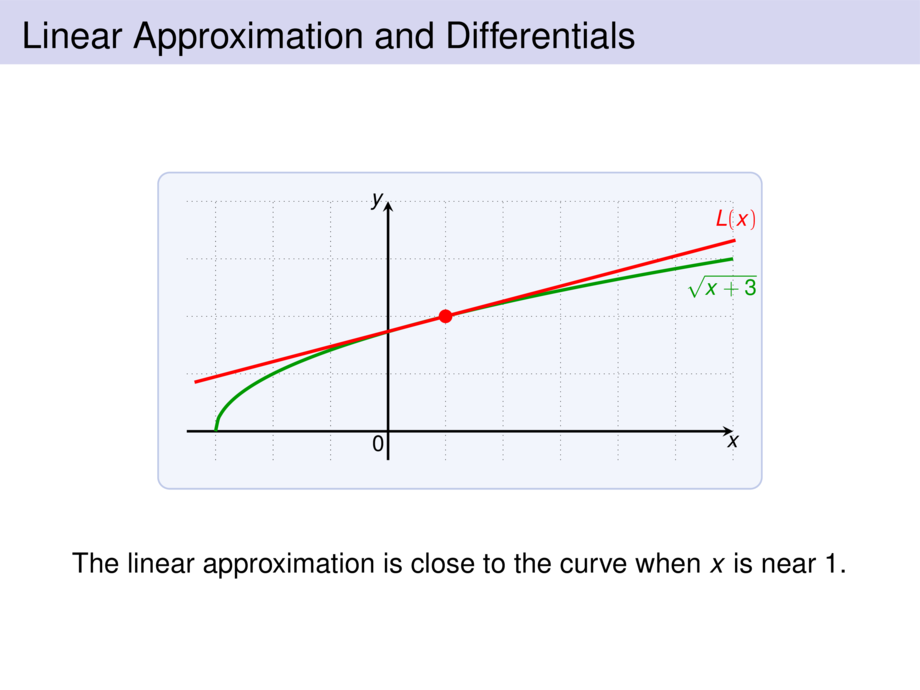
\frametitle{Linear Approximation and Differentials}
\begin{center}
\scalebox{.8}{
\begin{tikzpicture}[default,baseline=1cm]
\diagram{-3.5}{6}{-.5}{4}{1}
\diagramannotatez
\begin{scope}[ultra thick]
\draw[cgreen,ultra thick] plot[smooth,domain=-3:6,samples=200] function{sqrt(x+3)} node[below,xshift=-2mm,yshift=-2mm] {$\sqrt{x+3}$};
\tangent{4.5cm}{5.2cm}{pow(\x+3,.5)}{1}
\node at(6.5,3.4) [cred,anchor=south east] {$L(x)$};
\node[include=cred] at (1,2) {};
\end{scope}
\end{tikzpicture}
}
\end{center}
\pause\bigskip
The linear approximation is close to the curve when $x$ is near $1$.
\end{frame}