

3/142
\begin{frame}
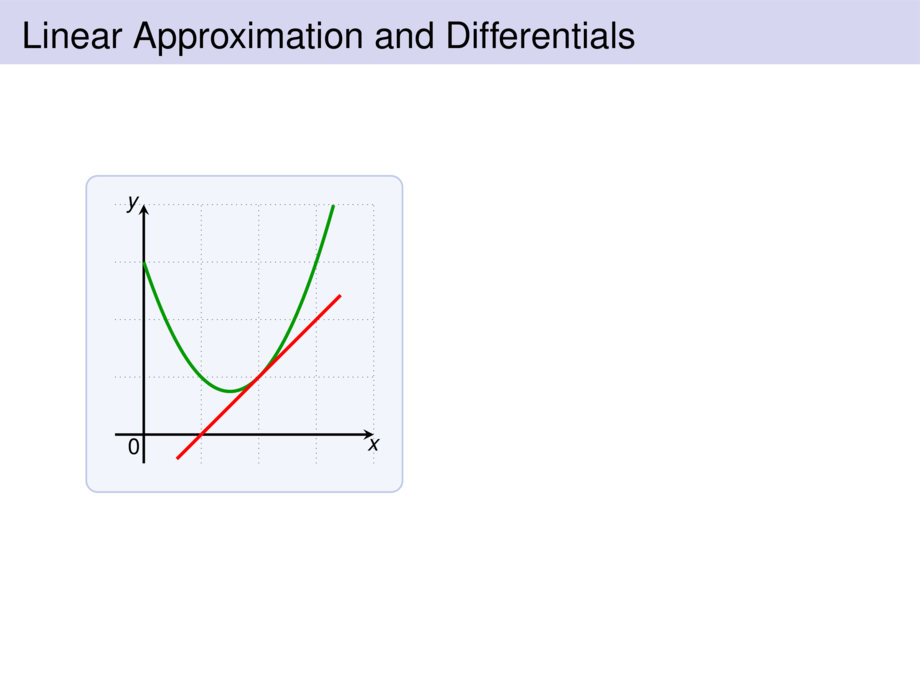
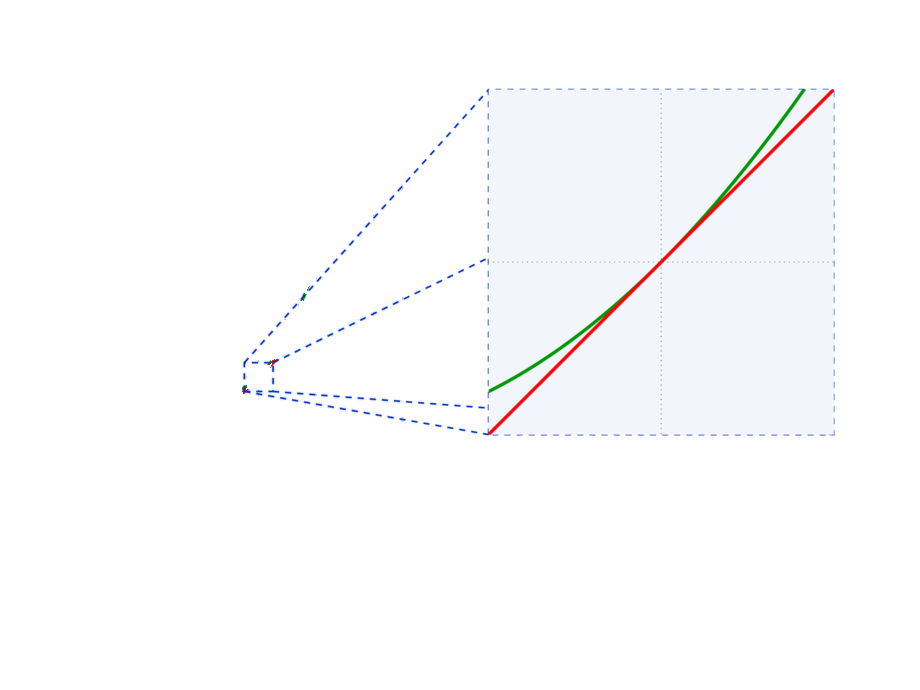
\frametitle{Linear Approximation and Differentials}
\begin{center}
\scalebox{.8}{
\begin{tikzpicture}[default,baseline=1cm]
\coordinate (l1) at (1.75,0.75);
\coordinate (l2) at (2.25,1.25);
\coordinate (l3) at (1.75,1.25);
\coordinate (l4) at (2.25,0.75);
\diagram{-.5}{4}{-.5}{4}{1}
\diagramannotatez
\begin{scope}[ultra thick]
\draw[cgreen,ultra thick] plot[smooth,domain=-0:3.3,samples=200] function{2+(x-1)**2 -x};
\tangent{2cm}{2cm}{2+pow(\x-1,2) -\x}{2}
\end{scope}
\mpause[1]{
\begin{scope}[xshift=-15cm,yshift=-9cm,xscale=12,yscale=12]
\coordinate (r1) at (1.75,0.75);
\coordinate (r2) at (2.25,1.25);
\coordinate (r3) at (1.75,1.25);
\coordinate (r4) at (2.25,0.75);
\begin{scope}[dashed,cblue]
\draw (l1) rectangle (l2);
\draw (r1) rectangle (r2);
\draw (l1) -- (r1);
\draw (l2) -- (r2);
\draw (l3) -- (r3);
\draw (l4) -- (r4);
\end{scope}
\clip (r1) rectangle (r2);
\diagram{-.5}{4}{-.5}{4}{1}
\diagramannotatez
\begin{scope}[ultra thick]
\draw[cgreen,ultra thick] plot[smooth,domain=-0:3.3,samples=200] function{2+(x-1)**2 -x};
\tangent{2cm}{2cm}{2+pow(\x-1,2) -\x}{2}
\end{scope}
\end{scope}
}
\end{tikzpicture}
}
\end{center}
\pause\pause
\begin{block}{}
A curve is very close to its tangent close to the point of tangency (touching).
\end{block}
We can use this for approximating values of the function\ldots
\vspace{10cm}
\end{frame}