


51/119
\begin{frame}
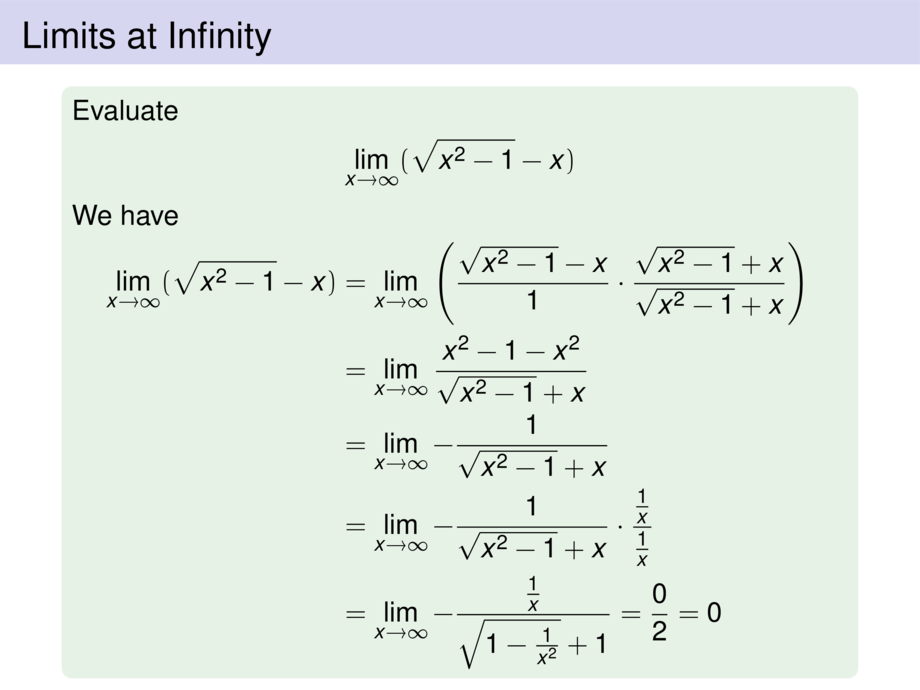
\frametitle{Limits at Infinity}
\begin{center}
\scalebox{.7}{
\begin{tikzpicture}[default,yscale=.8]
\diagram{-7}{7}{-2}{2}{1}
\diagramannotatez
\diagramannotatexx{-pi/$-\pi$,pi/$\pi$}
\diagramannotateyy{{-0.5*pi}/$-\frac{\pi}{2}$,{0.5*pi}/$\frac{\pi}{2}$}
\draw[cgreen,ultra thick] plot[smooth,domain=-7:7,samples=50] function{atan(x)};
\draw[cred,dashed] (-7,-0.5*pi) -- (7,-0.5*pi);
\draw[cred,dashed] (-7,0.5*pi) -- (7,0.5*pi);
\end{tikzpicture}
}
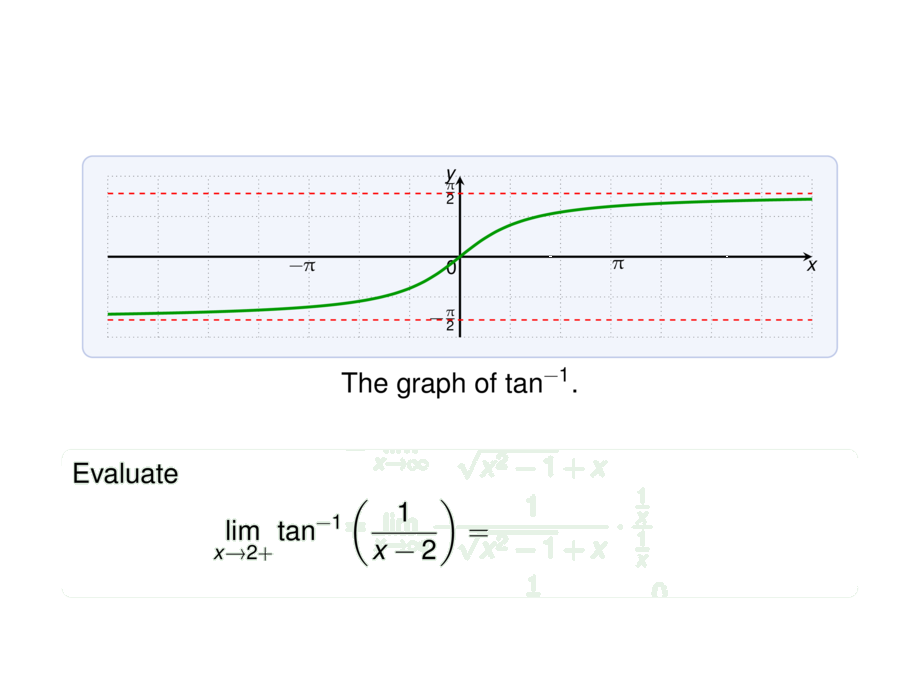
The graph of $\tan^{-1}$.
\end{center}
\begin{exampleblock}{}
Evaluate
\begin{talign}
\lim_{x\to 2+} \tan^{-1} \left(\frac{1}{x-2}\right) =
\mpause[1]{\lim_{x\to \infty} \tan^{-1} x =}
\mpause[2]{\frac{\pi}{2}}
\end{talign}
\pause\pause
\end{exampleblock}
\end{frame}