


115/154
\begin{frame}
\frametitle{Infinite Limits: Example}
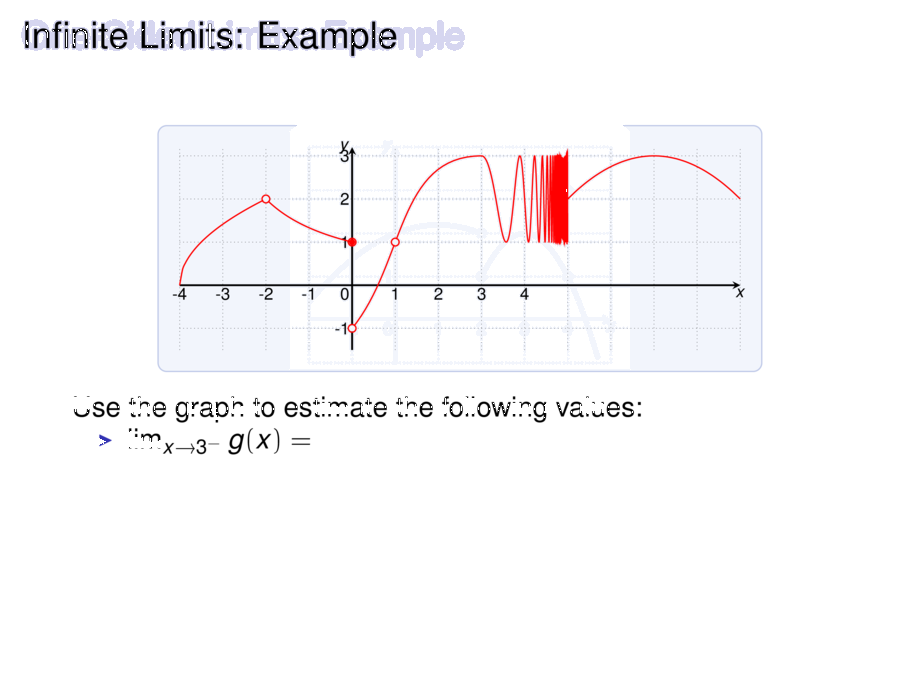
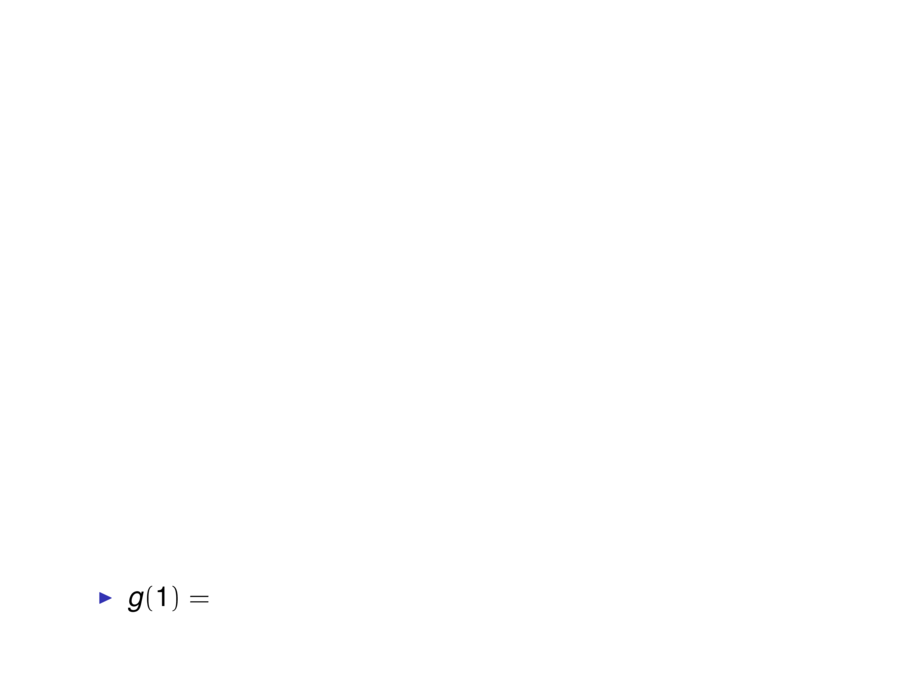
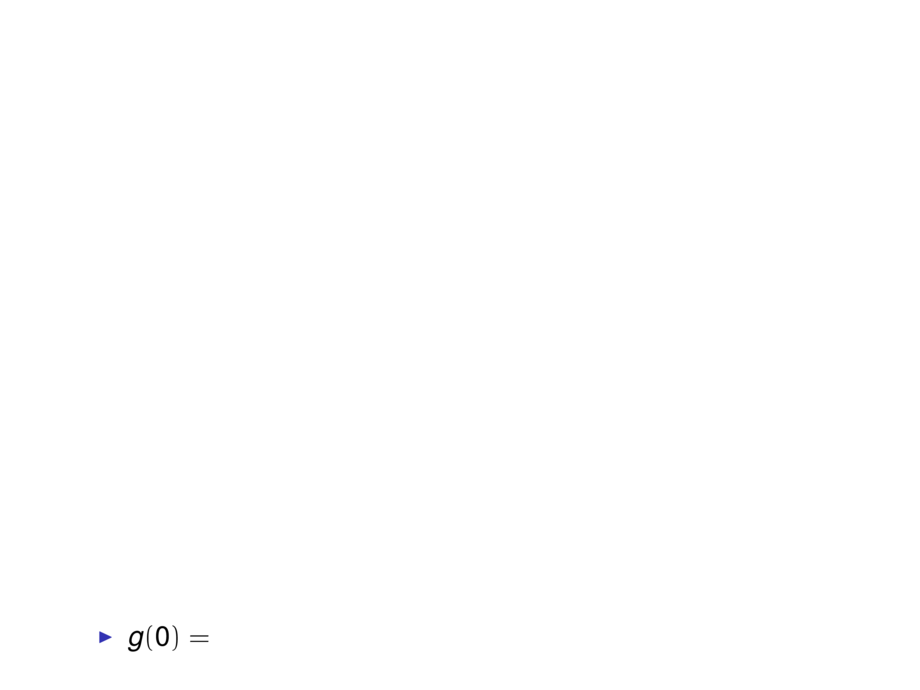
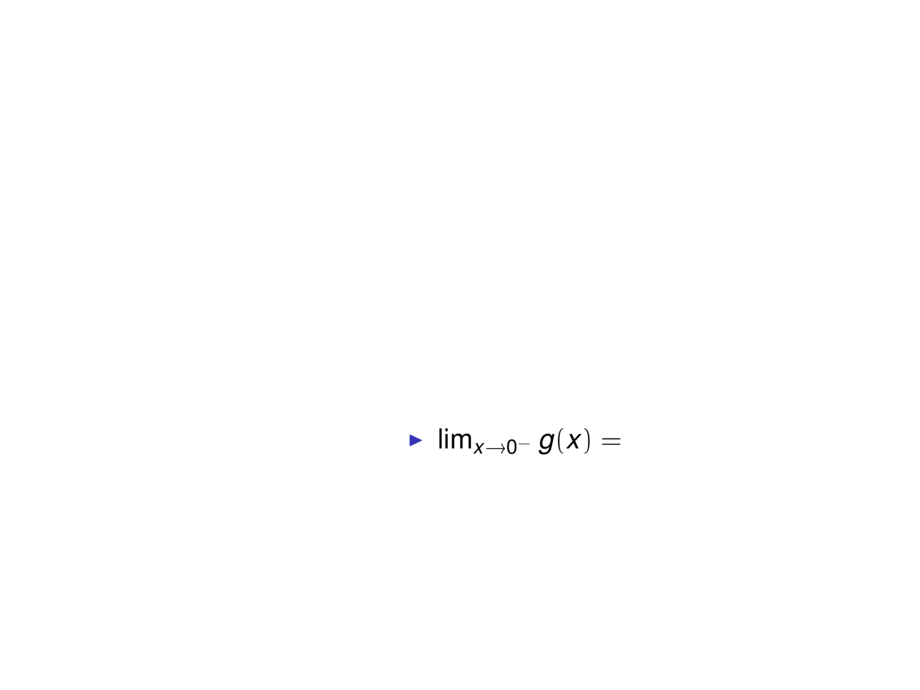
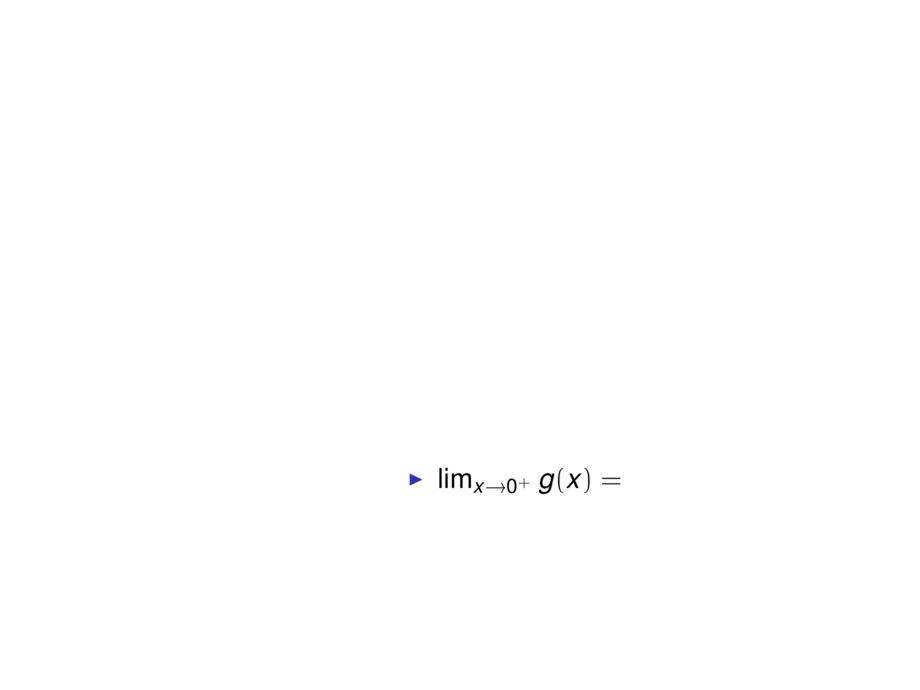
Consider the following graph of function $g(x)$:
\begin{center}
\scalebox{.6}{
\begin{tikzpicture}[default]
\diagram{-4}{9}{-1.5}{3.2}{1}
\diagramannotatez
\diagramannotatex{-4,-3,-2,-1,1,2,3,4}
\diagramannotatey{-1,1,2,3}
\draw[cred] plot[smooth,domain=-4:-2,samples=30] function{2*sqrt((x+4)/2)};
\draw[cred] plot[smooth,domain=-2:0,samples=20] function{4/(x+4)};
\draw[cred] (0,-1) to[out=51,in=180] (3,3);
\draw[cred] plot[smooth,domain=3:5,samples=1000] function{2-sin(5*pi/(x-5))};
\draw[cred] plot[smooth,domain=5:9,samples=20] function{3-((x-7)**2)/4};
\node[exclude={cred}] at (-2,2) {};
\node[include={cred}] at (0,1) {};
\node[exclude={cred}] at (0,-1) {};
\node[exclude={cred}] at (1,1) {};
\end{tikzpicture}
}
\end{center}
Use the graph to estimate the following values:
\smallskip
\begin{minipage}{.39\textwidth}
\begin{itemize}
\item $\lim_{x\to 3^-} g(x) = \pause 3$\pause
\item $\lim_{x\to 3^+} g(x) = \pause 3$\pause
\item $\lim_{x\to 3} g(x) = \pause 3$\pause
\item $\lim_{x\to 1} g(x) = \pause 1$\pause
\item $g(1) = \pause \text{undefined}$\pause
\item $g(0) = \pause 1$\pause
\end{itemize}
\end{minipage}
\begin{minipage}{.59\textwidth}
\begin{itemize}
\item $\lim_{x\to 0^-} g(x) = \pause 1$\pause
\item $\lim_{x\to 0^+} g(x) = \pause -1$\pause
\item $\lim_{x\to 0} g(x) = \pause \text{does not exist}$\hspace*{-2cm}\pause
\item $\lim_{x\to 5^-} g(x) = \pause \text{does not exist}$\hspace*{-2cm}\pause
\item $\lim_{x\to 5^+} g(x) = \pause 2$\pause
\item $\lim_{x\to 5} g(x) = \pause \text{does not exist}$\hspace*{-3cm}\hphantom{a}
\end{itemize}
\end{minipage}
\vspace{10cm}
\end{frame}