

136/353
\begin{frame}
\frametitle{Exponential Functions: Three Types}
\begin{center}
\begin{minipage}{.45\textwidth}
\scalebox{.6}{
\begin{tikzpicture}[default,baseline=0cm,scale=1.2,nodes={scale=.9}]
{\diagram{-2.5}{2.5}{-.5}{3}{1}}
\diagramannotatez
\diagramannotatey{1}
\begin{scope}[ultra thick]
\draw[cblue] plot[smooth,domain=-1.6:2.5,samples=300] (\x,{.5^\x});
\end{scope}
\end{tikzpicture}
}\\[.5ex]
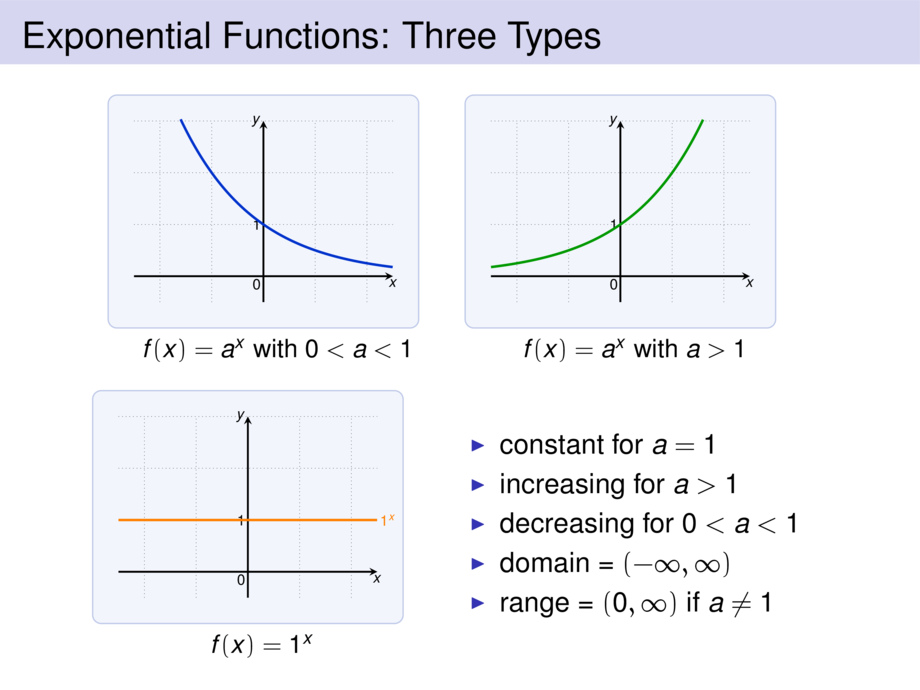
\centerline{{\small $f(x) = a^x$ with $0 < a < 1$}}
\end{minipage}
\begin{minipage}{.45\textwidth}
\scalebox{.6}{
\begin{tikzpicture}[default,baseline=0cm,scale=1.2,nodes={scale=.9}]
{\diagram{-2.5}{2.5}{-.5}{3}{1}}
\diagramannotatez
\diagramannotatey{1}
\begin{scope}[ultra thick]
\draw[cgreen] plot[smooth,domain=-2.5:1.6,samples=300] (\x,{2^\x});
\end{scope}
\end{tikzpicture}
}\\[.5ex]
\centerline{{\small $f(x) = a^x$ with $a > 1$}}
\end{minipage}
\bigskip
\begin{minipage}{.45\textwidth}
\scalebox{.6}{
\begin{tikzpicture}[default,baseline=0cm,scale=1.2,nodes={scale=.9}]
{\diagram{-2.5}{2.5}{-.5}{3}{1}}
\diagramannotatez
\diagramannotatey{1}
\begin{scope}[ultra thick]
\draw[orange] plot[smooth,domain=-2.5:2.5,samples=300] (\x,{1^\x}) node [right] {$1^x$};
\end{scope}
\end{tikzpicture}
}\\[.5ex]
\centerline{{\small $f(x) = 1^x$}}
\end{minipage}
\begin{minipage}{.50\textwidth}
\begin{itemize}
\pause
\item constant for $a = 1$
\pause
\item increasing for $a > 1$
\pause
\item decreasing for $0 < a < 1$
\pause
\item domain = $(-\infty,\infty)$
\pause
\item range = $(0,\infty)$ if $a\ne 1$
\end{itemize}
\end{minipage}
\end{center}
\end{frame}