

78/353
\begin{frame}
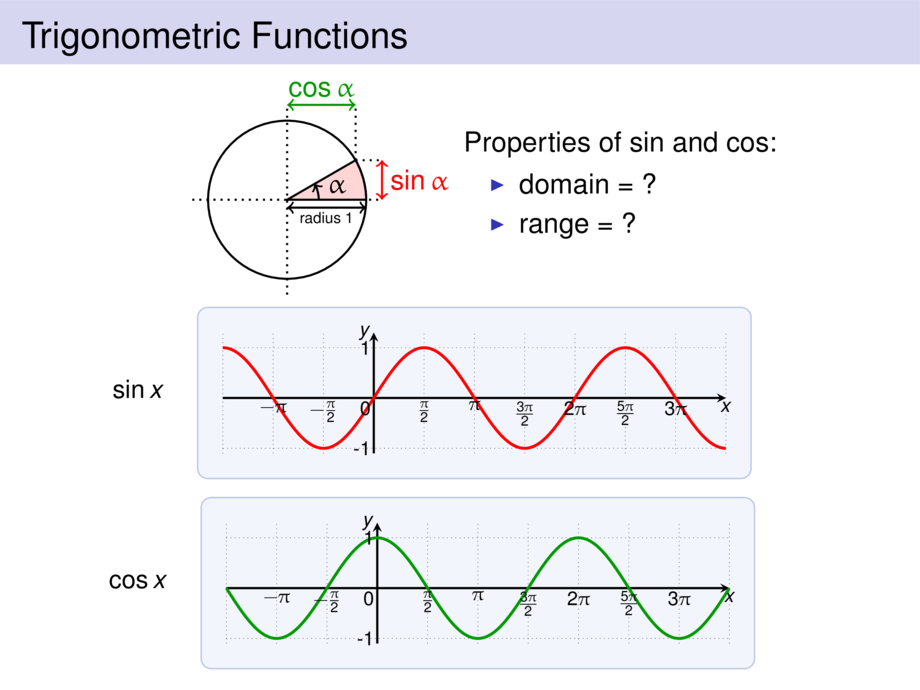
\frametitle{Trigonometric Functions}
\vspace{-1ex}
\begin{center}
\begin{minipage}{.49\textwidth}\hspace{1.5cm}
\begin{tikzpicture}[default,scale=1.1]
\draw (0,0) circle (1cm);
\draw[fill=clred!20] (0,0) to (30:1cm) arc (30:0:1cm) -- cycle;
\draw[->] (.4cm,0) arc (0:30:.4cm);
\node at (15:.65cm) {$\alpha$};
\draw[dotted] (-1.2,0) -- (1.2,0);
\draw[dotted] (0,-1.2) -- (0,1.2);
\draw[<->] (0,-.1) -- node[below] {{\tiny radius $1$}} (1,-.1);
\draw[dotted] (30:1cm) -- ({sqrt(3/4)},1.2);
\draw[cgreen,<->] (0,1.2) -- node[above,inner sep=1mm] {$\cos \alpha$} ({sqrt(3/4)},1.2);
\draw[dotted] (30:1cm) -- (1.2,1/2);
\draw[cred,<->] (1.2,0) -- node[right,inner sep=1mm] {$\sin \alpha$} (1.2,1/2);
\end{tikzpicture}
\end{minipage}
\begin{minipage}{.49\textwidth}
\onslide<2->{
Properties of $\sin$ and $\cos$:
\begin{itemize}
\item domain = \alt<-2>{?}{$(-\infty,\infty)$}
\item range = \alt<-2>{?}{$[-1,1]$}
\end{itemize}
}\onslide<3>{}
\end{minipage}
\end{center}
\vspace{-1.5ex}
\begin{center}
{\small $\sin x$}\quad\scalebox{.7}{
\begin{tikzpicture}[default,baseline=0cm]
\diagram{-3}{7}{-1.1}{1.3}{1}
\begin{scope}[ultra thick]
\draw[cred] plot[smooth,domain=-3:7,samples=300] (\x,{sin(\x*90)});
\end{scope}
\diagramannotatez
\diagramannotatexx{-2/$-\pi$,-1/$-\frac{\pi}{2}$,1/$\frac{\pi}{2}$,2/$\pi$,3/$\frac{3\pi}{2}$,4/$2\pi$,5/$\frac{5\pi}{2}$,6/$3\pi$}
\diagramannotatey{1,-1}
\end{tikzpicture}\hspace{1cm}
}
\end{center}
\begin{center}
{\small $\cos x$}\quad\scalebox{.7}{
\begin{tikzpicture}[default,baseline=0cm]
\diagram{-3}{7}{-1.1}{1.3}{1}
\begin{scope}[ultra thick]
\draw[cgreen] plot[smooth,domain=-3:7,samples=300] (\x,{cos(\x*90)});
\end{scope}
\diagramannotatez
\diagramannotatexx{-2/$-\pi$,-1/$-\frac{\pi}{2}$,1/$\frac{\pi}{2}$,2/$\pi$,3/$\frac{3\pi}{2}$,4/$2\pi$,5/$\frac{5\pi}{2}$,6/$3\pi$}
\diagramannotatey{1,-1}
\end{tikzpicture}\hspace{1cm}
}
\end{center}
\vspace{10cm}
\end{frame}