

38/353
\begin{frame}
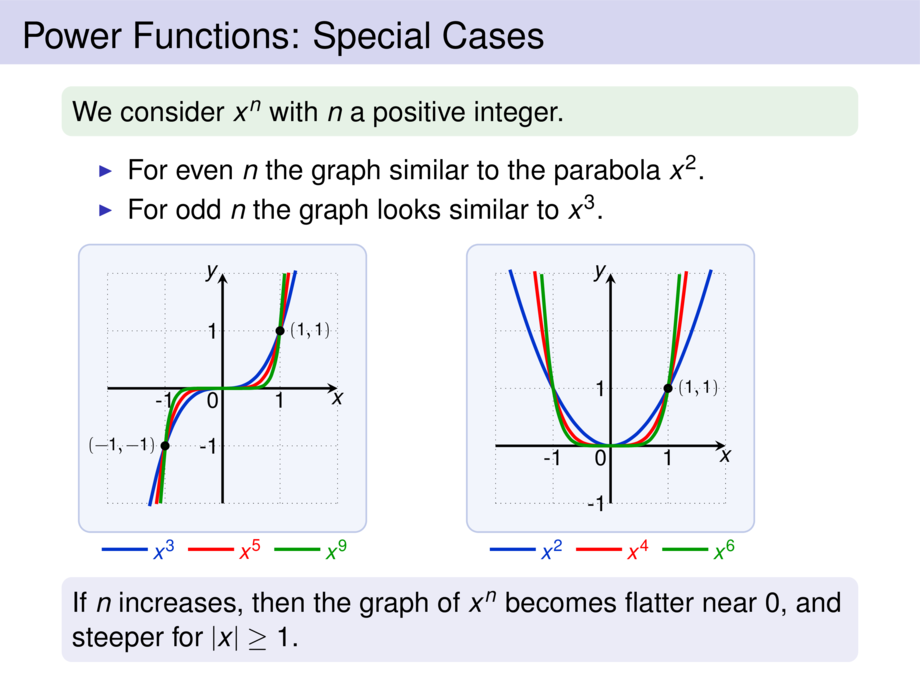
\frametitle{Power Functions: Special Cases}
\begin{exampleblock}{}
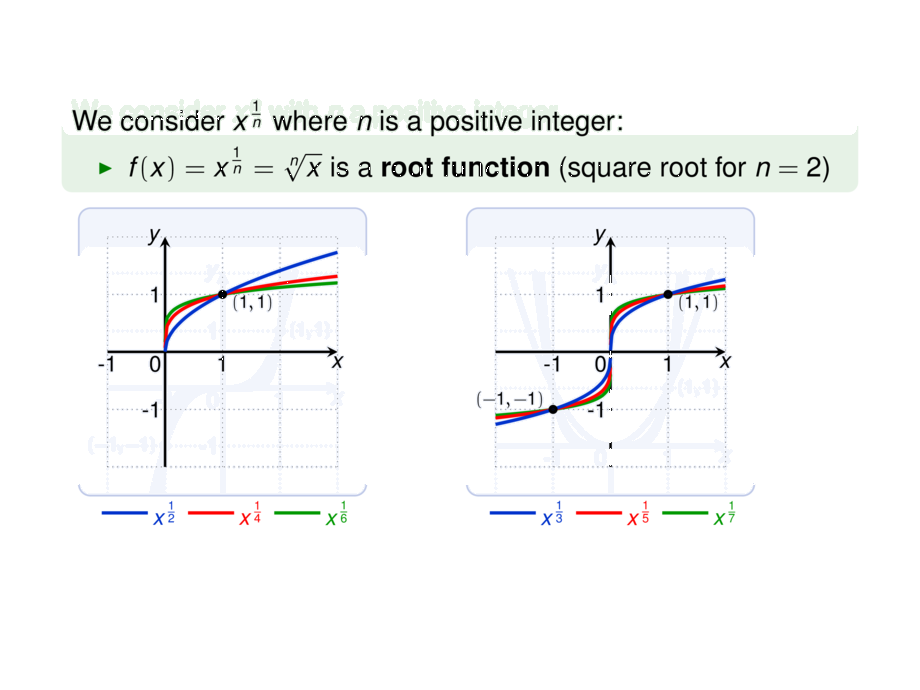
We consider $x^{\frac{1}{n}}$ where $n$ is a positive integer:
\begin{itemize}
\item $f(x) = x^{\frac{1}{n}} = \sqrt[n]{x}$ is a \emph{root function} (square root for $n=2$)
\end{itemize}
\end{exampleblock}
\medskip
\begin{minipage}{.49\textwidth}
\scalebox{.8}{
\begin{tikzpicture}[default,baseline=0ex]
\diagram{-1}{3}{-2}{2}{1}
\diagramannotatez
\diagramannotatex{-1,1}
\diagramannotatey{-1,1}
\begin{scope}[ultra thick]
\draw[cgreen] plot[smooth,domain=0.00001:3,samples=100] (\x,{pow(\x,1/6)});
\draw[cred] plot[smooth,domain=0.00001:3,samples=100] (\x,{pow(\x,1/4)});
\draw[cblue] plot[smooth,domain=0.00001:3,samples=100] (\x,{pow(\x,1/2)});
\draw[cblue] (-1.1cm,-2.8cm) -- node [at end,right] {$x^{\frac{1}{2}}$} +(.8cm,0);
\draw[cred] (0.4cm,-2.8cm) -- node [at end,right] {$x^{\frac{1}{4}}$} +(.8cm,0);
\draw[cgreen] (1.9cm,-2.8cm) -- node [at end,right] {$x^{\frac{1}{6}}$} +(.8cm,0);
\node (a) [include=black,minimum size=1mm] at (1,1) {};
\node[r=(a),yshift=-2mm] {$(1,1)$};
\end{scope}
\end{tikzpicture}
}
\end{minipage}
\begin{minipage}{.49\textwidth}
\scalebox{.8}{
\begin{tikzpicture}[default,baseline=1cm]
\diagram{-2}{2}{-2}{2}{1}
\diagramannotatez
\diagramannotatex{-1,1}
\diagramannotatey{-1,1}
\begin{scope}[ultra thick]
\draw[cgreen] plot[smooth,domain=0.00001:2,samples=100] (\x,{pow(\x,1/7)});
\draw[cgreen] plot[smooth,domain=-2:-0.00001,samples=100] (\x,{-pow(-\x,1/7)});
\draw[cred] plot[smooth,domain=0.00001:2,samples=100] (\x,{pow(\x,1/5)});
\draw[cred] plot[smooth,domain=-2:-0.00001,samples=100] (\x,{-pow(-\x,1/5)});
\draw[cblue] plot[smooth,domain=0.00001:2,samples=100] (\x,{pow(\x,1/3)});
\draw[cblue] plot[smooth,domain=-2:-0.00001,samples=100] (\x,{-pow(-\x,1/3)});
\draw[cblue] (-2.1cm,-2.8cm) -- node [at end,right] {$x^{\frac{1}{3}}$} +(.8cm,0);
\draw[cred] (-.6cm,-2.8cm) -- node [at end,right] {$x^{\frac{1}{5}}$} +(.8cm,0);
\draw[cgreen] (.9cm,-2.8cm) -- node [at end,right] {$x^{\frac{1}{7}}$} +(.8cm,0);
\node (a) [include=black,minimum size=1mm] at (1,1) {};
\node[r=(a),yshift=-2mm] {$(1,1)$};
\node (b) [include=black,minimum size=1mm] at (-1,-1) {};
\node[l=(b),yshift=2mm] {$(-1,-1)$};
\end{scope}
\end{tikzpicture}
}
\end{minipage}
\pause\medskip
\begin{itemize}
\item For even $n$ the domain is $[0,\infty)$,
the graph is similar to $\sqrt{x}$.
\item For odd $n$ the domain is $\mathbb{R}$,
the graph is similar to $\sqrt[3]{x}$.
\end{itemize}
\vspace{10cm}
\end{frame}