

32/353
\begin{frame}
\frametitle{Power Functions}
\vspace{-1ex}
\begin{block}{}
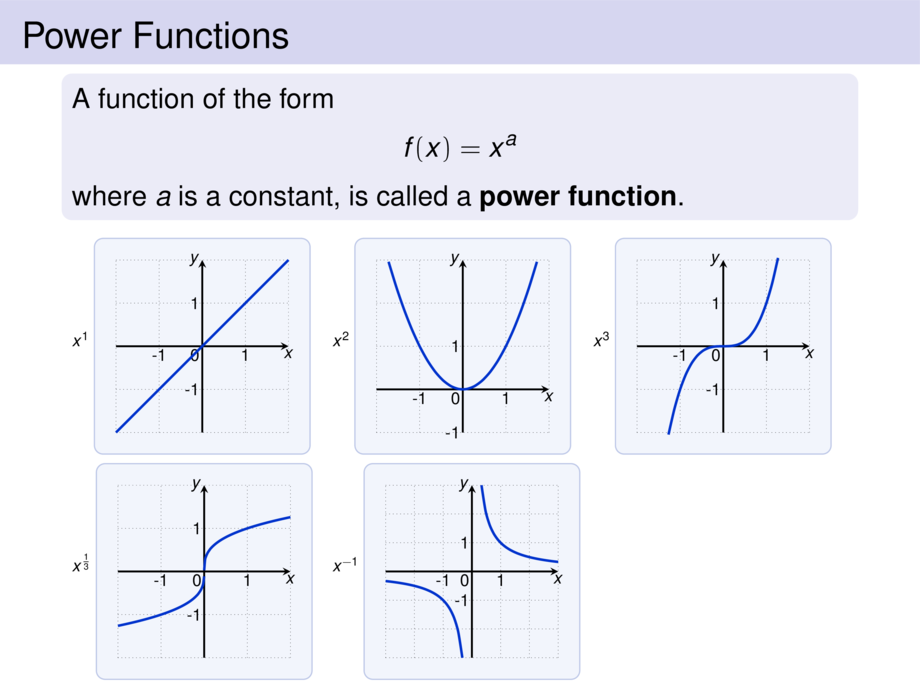
A function of the form
\begin{talign}
f(x) = x^a
\end{talign}
where $a$ is a constant, is called a \emph{power function}.
\end{block}
\medskip
\begin{minipage}{.3\textwidth}
\scalebox{.6}{$x^1$
\begin{tikzpicture}[default,baseline=0ex]
\diagram{-2}{2}{-2}{2}{1}
\diagramannotatez
\diagramannotatex{-1,1}
\diagramannotatey{-1,1}
\draw[cblue,ultra thick] plot[smooth,domain=-2:2,samples=20] (\x,{pow(\x,1)});
\end{tikzpicture}
}
\end{minipage}\quad
\begin{minipage}{.3\textwidth}
\scalebox{.6}{$x^2$
\begin{tikzpicture}[default,baseline=1cm]
\diagram{-2}{2}{-1}{3}{1}
\diagramannotatez
\diagramannotatex{-1,1}
\diagramannotatey{-1,1}
\draw[cblue,ultra thick] plot[smooth,domain=-1.72:1.72,samples=20] (\x,{pow(\x,2)});
\end{tikzpicture}
}
\end{minipage}\quad
\begin{minipage}{.3\textwidth}
\scalebox{.6}{$x^3$
\begin{tikzpicture}[default,baseline=0ex]
\diagram{-2}{2}{-2}{2}{1}
\diagramannotatez
\diagramannotatex{-1,1}
\diagramannotatey{-1,1}
\draw[cblue,ultra thick] plot[smooth,domain=-1.27:1.27,samples=20] (\x,{pow(\x,3)});
\end{tikzpicture}
}
\end{minipage}
\smallskip
\begin{minipage}{.3\textwidth}
\scalebox{.6}{$x^{\frac{1}{3}}$
\begin{tikzpicture}[default,baseline=0ex]
\diagram{-2}{2}{-2}{2}{1}
\diagramannotatez
\diagramannotatex{-1,1}
\diagramannotatey{-1,1}
\draw[cblue,ultra thick] plot[smooth,domain=0.00001:2,samples=100] (\x,{pow(\x,1/3)});
\draw[cblue,ultra thick] plot[smooth,domain=-2:0.00001,samples=100] (\x,{-pow(-\x,1/3)});
\end{tikzpicture}
}
\end{minipage}\quad
\begin{minipage}{.3\textwidth}
\scalebox{.6}{$x^{-1}$
\begin{tikzpicture}[default,baseline=0ex,scale=2/3]
{\def\diaborderx{.5cm*3/2}
\def\diabordery{.5cm*3/2}
\diagram{-3}{3}{-3}{3}{1}}
\diagramannotatez
\diagramannotatex{-1,1}
\diagramannotatey{-1,1}
\draw[cblue,ultra thick] plot[smooth,domain=0.3333:3,samples=20] (\x,{pow(\x,-1)});
\draw[cblue,ultra thick] plot[smooth,domain=-3:-0.3333,samples=20] (\x,{pow(\x,-1)});
\end{tikzpicture}
}
\end{minipage}
\end{frame}