

8/353
\begin{frame}
\frametitle{Linear Functions}
\begin{block}{}
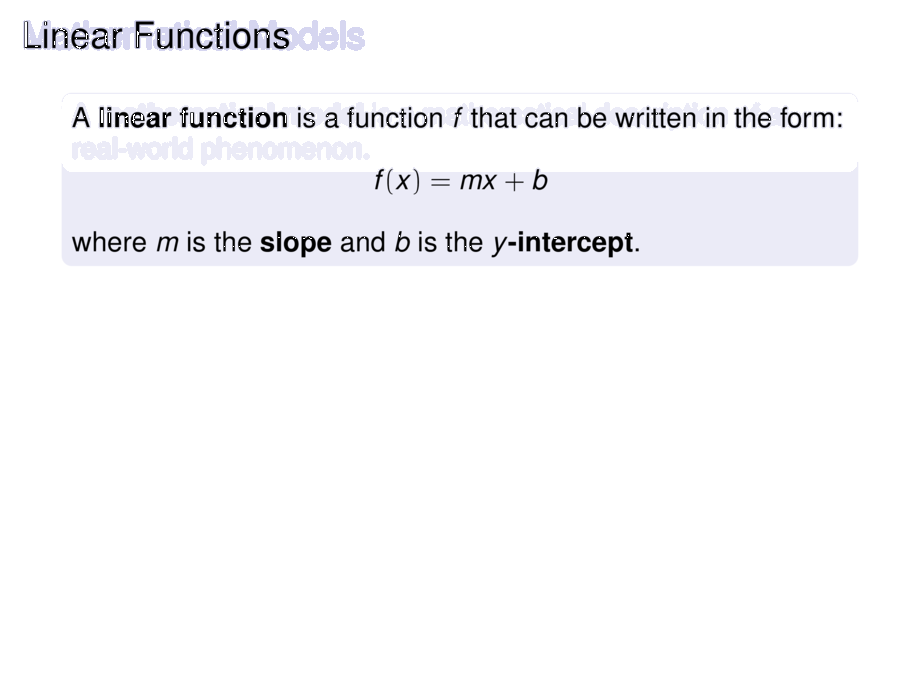
A \emph{linear function} is a function $f$ that can be written in the form:
\begin{align*}
f(x) = mx + b
\end{align*}
where $m$ is the \emph{slope} and $b$ is the \emph{$y$-intercept}.
\end{block}
\pause\medskip
The graph of a linear function is a line:
\begin{center}
\scalebox{.6}{
\begin{tikzpicture}[default]
\diagram{-2}{4}{-2}{4}{1}
\diagramannotatez
\diagramannotatex{-1,1,2,3}
\diagramannotatey{-1,1,2,3}
\draw[cblue,ultra thick] plot[smooth,domain=-1/3:2-1/3,samples=20] (\x,{3*\x - 1}) node[right] {$f(x) = 3x - 1$};
\end{tikzpicture}
}
\end{center}
\end{frame}