

32/101
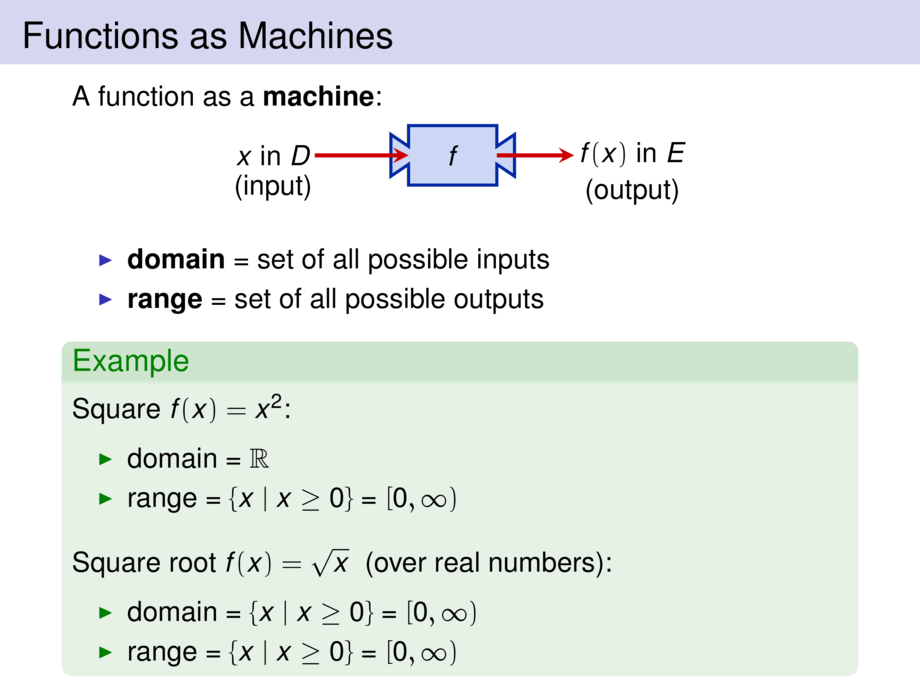
\begin{frame}
\frametitle{Visualizing Functions as Graphs}
\begin{block}{}
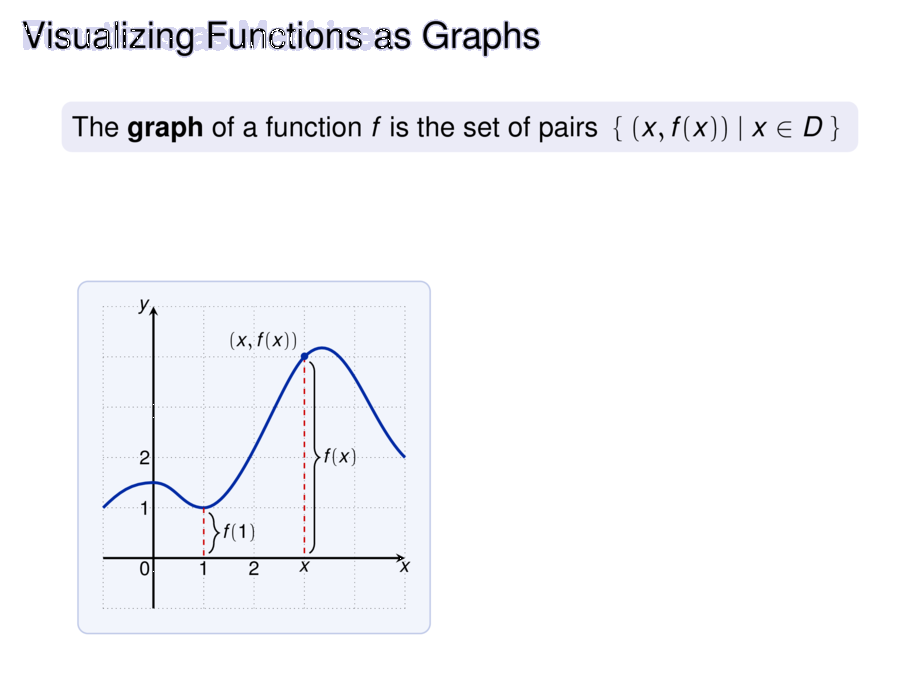
The \emph{graph} of a function $f$ is the set of pairs \;$\{\;(x,f(x)) \mid x \in D\;\}$
\end{block}
\begin{itemize}
\item<2-> set of all points $(x,y)$ in the coordinate plane\\
such that $y = f(x)$ and $x$ is in the domain
\end{itemize}
\begin{center}
\scalebox{.7}{
\begin{tikzpicture}[default]
\diagram{-1}{5}{-1}{5}{1}
\diagramannotate
\begin{scope}[cdblue,ultra thick]
\draw (-1cm,1cm) to[in=180] (0,1.5cm) to[out=0,in=180] (1cm,1cm) to[out=0,in=-135,looseness=.5] (3cm,4cm) to[out=45,in=135] (5cm,2cm);
\end{scope}
\begin{scope}
\draw [cdred,dashed] (1cm,1cm) -- (1cm,0cm);
\draw [decorate,decoration={brace,amplitude=2mm},xshift=1mm] (1cm,.9cm) -- node [right,xshift=2mm] {$f(1)$} (1cm,0.1cm);
\draw [cdred,dashed] (3cm,4cm) -- (3cm,0cm);
\draw [decorate,decoration={brace,amplitude=2mm},xshift=1mm] (3cm,3.9cm) -- node [right,xshift=2mm] {$f(x)$} (3cm,0.1cm);
\node (x) [anchor=north] at (3cm,0cm) {$x$};
\node (p) [cdblue,inner sep=0] at (3cm,4cm) {$\bullet$};
\node [at=(p.north west),anchor=south east,inner sep=0] {$(x,f(x))$};
\end{scope}
\end{tikzpicture}
}\pause\pause\quad\nolinebreak
\scalebox{.7}{%
\begin{tikzpicture}[default]
\diagram{-1.5}{5}{-1}{5}{0}
\begin{scope}[cdblue,ultra thick]
\draw (1cm,1.5cm) to[in=180] (3cm,3.5cm) to[out=0,in=120] (4cm,2.5cm);
\node [cdblue] (start) at (1cm,1.5cm) {$\bullet$};
\node [cdblue] (end) at (4cm,2.5cm) {$\bullet$};
\node [cdblue] (high) at (3cm,3.5cm) {};
\node [clblue] (d1) at (1cm,0cm) {$\bullet$};
\node [clblue] (d2) at (4cm,0cm) {$\bullet$};
\node [clblue] (r1) at (0cm,1.5cm) {$\bullet$};
\node [clblue] (r2) at (0cm,3.5cm) {$\bullet$};
\begin{scope}[dashed,thick]
\draw (r1) -- (start);
\draw (r2) -- (high);
\draw (d1) -- (start);
\draw (d2) -- (end);
\end{scope}
\begin{scope}[black]
\draw [decorate,decoration={brace,amplitude=2mm},xshift=-3mm] (r1.west) -- node [left,xshift=-3mm] {range} (r2.west);
\draw [decorate,decoration={brace,amplitude=2mm},xshift=3mm] (d2.south) -- node [below,yshift=-3mm] {domain} (d1.south);
\end{scope}
\end{scope}
\begin{scope}
\end{scope}
\end{tikzpicture}
}
\end{center}
\end{frame}