

34/60
\begin{frame}
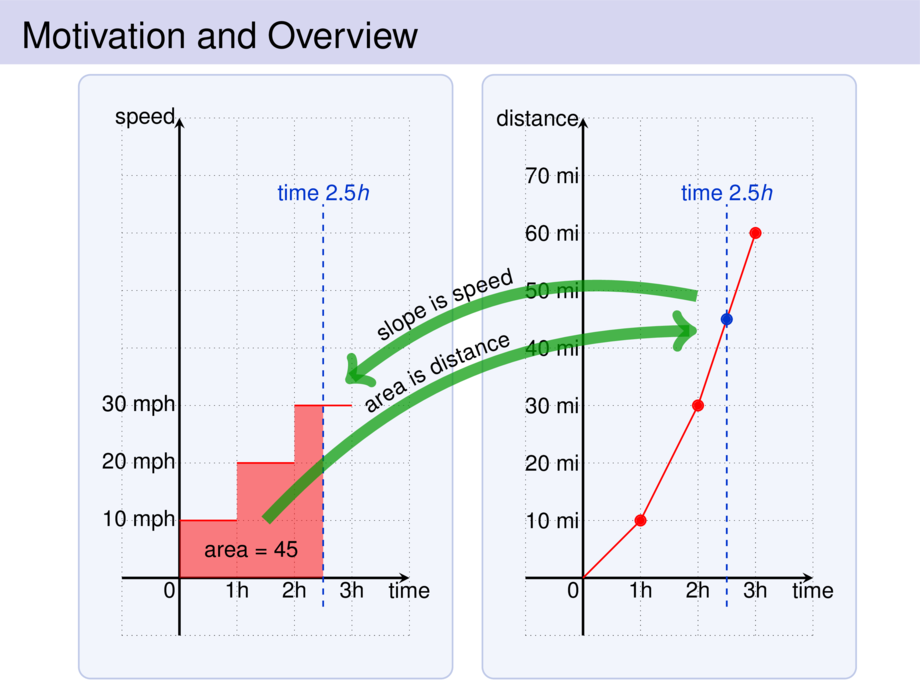
\frametitle{Motivation and Overview}
\scalebox{.8}{
\begin{tikzpicture}[default]
\def\mfun{(4*(\x+\mfunshift) - 2.6*(\x+\mfunshift)^2 + .44*(\x+\mfunshift)^3)}
\def\diax{\text{time}}
\def\diay{\text{speed}}
\def\diaborderx{.75cm}
\def\diabordery{.75cm}
\diagram[1]{-1}{4}{-1}{8}{1}
\diagramannotatez
\diagramannotatexx{1/1h,2/2h,3/3h}
\diagramannotateyy{1/10 \text{mph},2/20 \text{mph},3/30 \text{mph},3/30 \text{mph}}
\def\mfunshift{0}
\draw[cred] plot[smooth,domain=0:4,samples=20] (\x,{\mfun});
\node[rectangle,rounded corners=2mm,fill=yellow!15,draw=black,thin,align=left,drop shadow,inner sep=1.5mm] at (1.5,6)
{\parbox{.52\textwidth}{
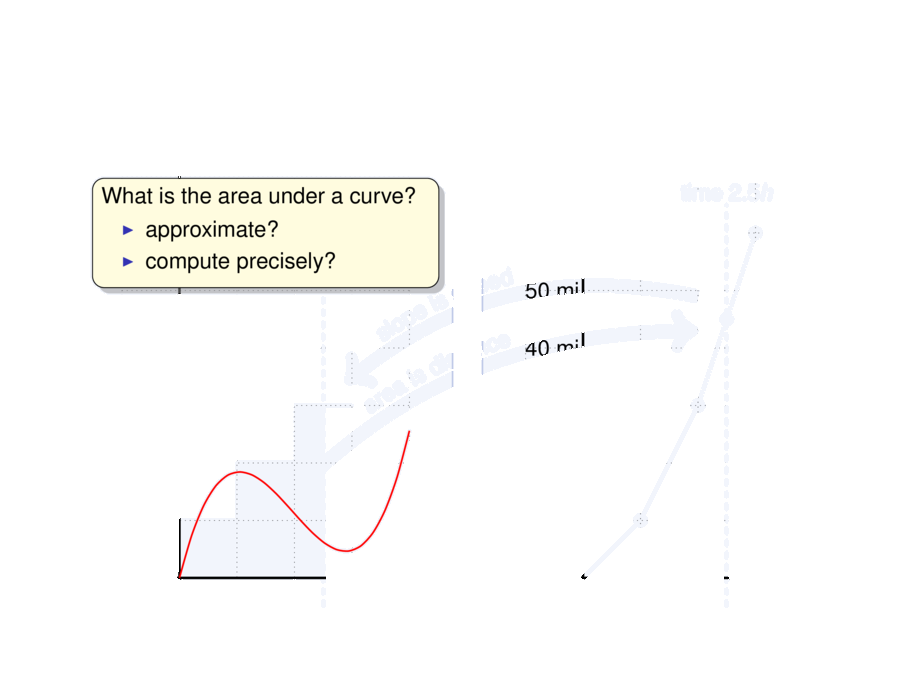
What is the area under a curve?
\begin{itemize}
\item approximate?
\item compute precisely?
\end{itemize}
}
};
\begin{scope}[xshift=.65\textwidth]
\def\diax{\text{time}}
\def\diay{\text{distance}}
\def\diaborderx{.75cm}
\def\diabordery{.75cm}
\diagram[1]{-1}{4}{-1}{8}{1}
\diagramannotatez
\diagramannotatexx{1/1h,2/2h,3/3h}
\diagramannotateyy{1/10 \text{mi},2/20 \text{mi},3/30 \text{mi},4/40 \text{mi},5/50 \text{mi},6/60 \text{mi},7/70 \text{mi}}
\coordinate (z) at (0,0);
\end{scope}
\def\mwidth{4}
\setcounter{slide}{2}
\foreach \nrsteps/\mcolor in {3/cred,7/cblue,15/cgreen} {
\setcounter{roundcounter}{\arabic{slide}}
\def\mstep{\mwidth/(\nrsteps+1)}
\def\mfunshift{\mstep}
\coordinate (p) at (z);
\foreach \xx in {0,...,\nrsteps} {
\def\x{\xx*\mstep}
\setcounter{tmpcount}{\arabic{roundcounter}}
\addtocounter{tmpcount}{\nrsteps}
\onslide<\arabic{slide}-\arabic{tmpcount}>{
\draw[draw=none,fill=\mcolor,opacity=.5] ({\x},0) rectangle ({\x+\mstep},{\mfun});
\node[include=\mcolor] at ({\x+\mfunshift},{\mfun}) {};
}
\onslide<\arabic{slide}->{
\begin{scope}[shift=(z)]
\coordinate (p') at ($(p) + ({\mstep},{\mstep*\mfun})$);
\node[\mcolor,include] at (p') {};
\draw[\mcolor] (p) -- (p');
\coordinate (p) at (p');
\end{scope}
}
\addtocounter{slide}{1}
}
}
\onslide<30->{
\begin{scope}[shift=(z)]
\draw[line width=3mm,cblue!5,opacity=.5] plot[smooth,domain=0:4,samples=20] (\x,{2*\x^2 - 2.6/3*\x^3 + .44/4*\x^4)});
\draw[line width=1mm,orange] plot[smooth,domain=0:4,samples=20] (\x,{2*\x^2 - 2.6/3*\x^3 + .44/4*\x^4)});
\end{scope}
\node[rectangle,rounded corners=2mm,fill=yellow!15,draw=black,thin,align=left,drop shadow,inner sep=1.5mm] at (5,-1)
{The finer approximations get closer and closer to the precise solution \tikz[baseline=-.5ex] \draw[line width=1mm,orange] (0,0) -- (1,0);.};
}
\end{tikzpicture}
}
\end{frame}