

27/60
\begin{frame}
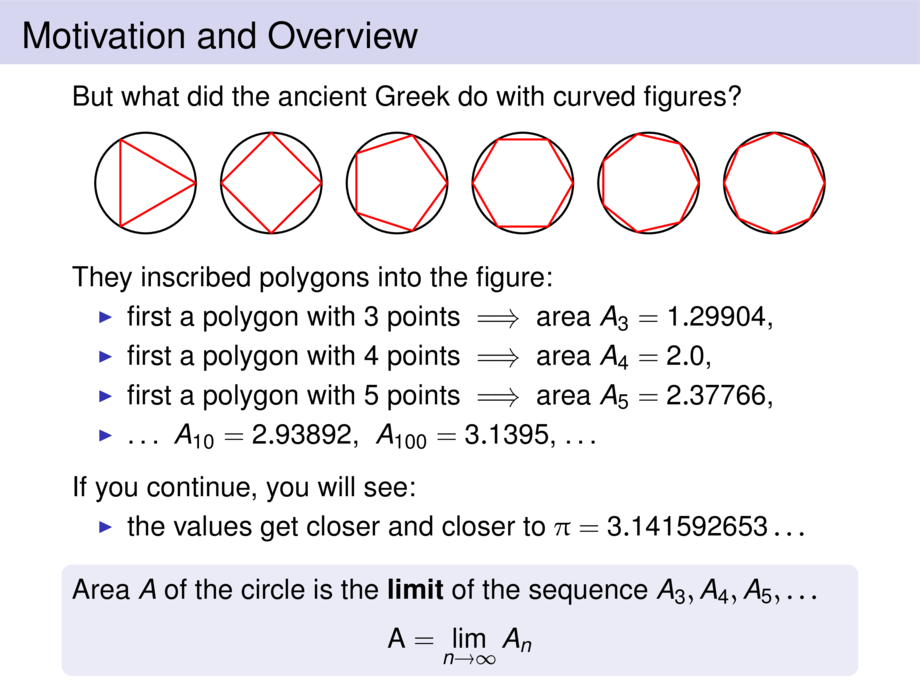
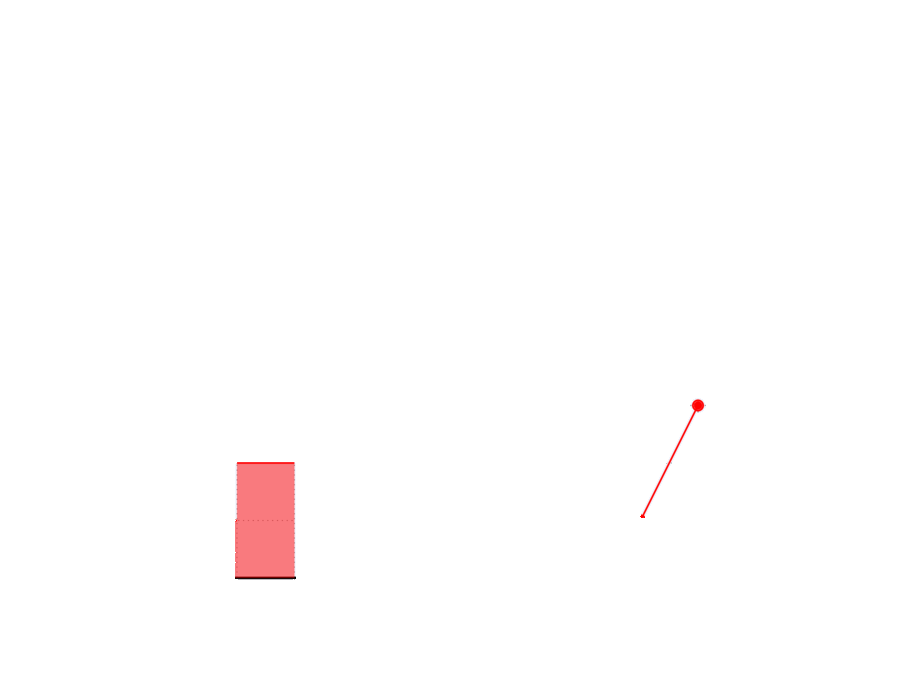
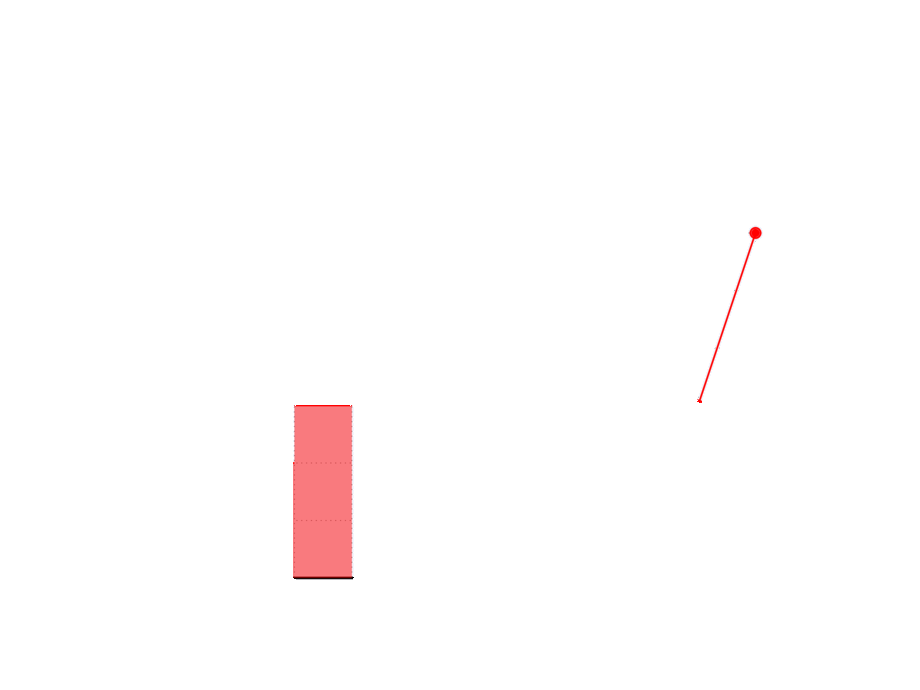
\frametitle{Motivation and Overview}
\scalebox{.8}{
\begin{tikzpicture}[default]
\def\diax{\text{time}}
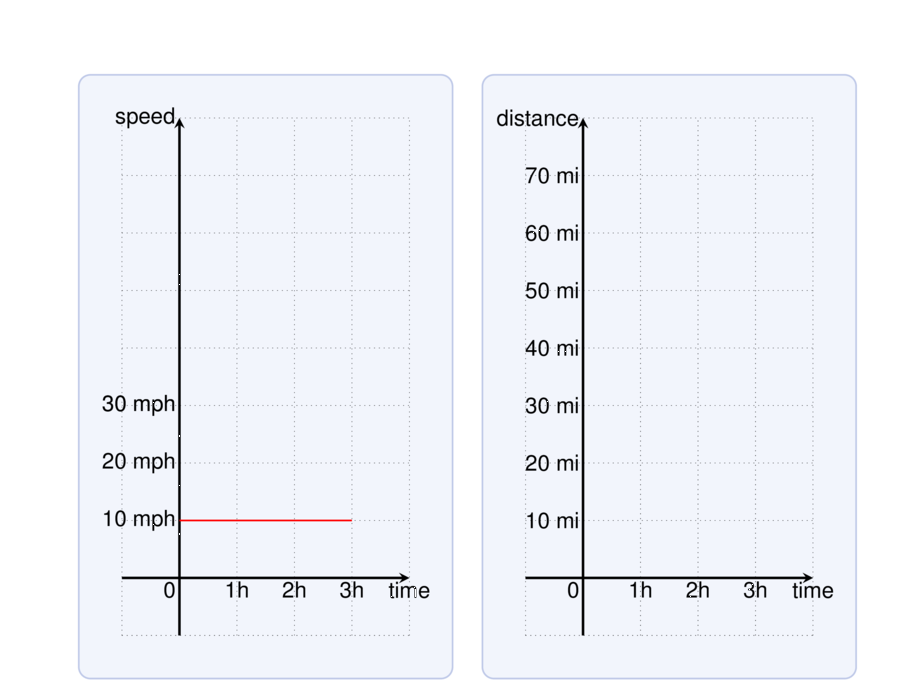
\def\diay{\text{speed}}
\def\diaborderx{.75cm}
\def\diabordery{.75cm}
\diagram[1]{-1}{4}{-1}{8}{1}
\diagramannotatez
\diagramannotatexx{1/1h,2/2h,3/3h}
\diagramannotateyy{1/10 \text{mph},2/20 \text{mph},3/30 \text{mph},3/30 \text{mph}}
\draw[cred] plot[smooth,domain=0:1,samples=20] (\x,{1});
\draw[cred] plot[smooth,domain=1:2,samples=20] (\x,{2});
\draw[cred] plot[smooth,domain=2:3,samples=20] (\x,{3});
\onslide<2->{ \draw[draw=none,fill=cred,opacity=.5] plot[ybar interval,domain=0:1,samples=2] (\x,{1}); }
\onslide<3->{ \draw[draw=none,fill=cred,opacity=.5] plot[ybar interval,domain=1:2,samples=2] (\x,{2}); }
\onslide<4>{ \draw[draw=none,fill=cred,opacity=.5] plot[ybar interval,domain=2:3,samples=2] (\x,{3}); }
\onslide<5->{
\draw[draw=none,fill=cred,opacity=.5] plot[ybar interval,domain=2:2.5,samples=2] (\x,{3});
\draw[dashed,cblue] (2.5,-.5) -- node [at end,above] {time $2.5h$} (2.5,6.5);
\node at (1.25,.5) {area = $45$};
}
\begin{scope}[xshift=.65\textwidth]
\def\diax{\text{time}}
\def\diay{\text{distance}}
\def\diaborderx{.75cm}
\def\diabordery{.75cm}
\diagram[1]{-1}{4}{-1}{8}{1}
\diagramannotatez
\diagramannotatexx{1/1h,2/2h,3/3h}
\diagramannotateyy{1/10 \text{mi},2/20 \text{mi},3/30 \text{mi},4/40 \text{mi},5/50 \text{mi},6/60 \text{mi},7/70 \text{mi}}
\pause
\node[cred,include] at (1,1) {};
\draw[cred] plot[smooth,domain=0:1,samples=20] (\x,{\x});
\pause
\node[cred,include] at (2,3) {};
\draw[cred] plot[smooth,domain=1:2,samples=20] (\x,{2*\x-1});
\pause
\node[cred,include] at (3,6) {};
\draw[cred] plot[smooth,domain=2:3,samples=20] (\x,{3*\x-3});
\pause
\node[include,cblue] at (2.5,4.5) {};
\draw[dashed,cblue] (2.5,-.5) -- node [at end,above] {time $2.5h$} (2.5,6.5);
\end{scope}
\begin{scope}[line width=2mm,cgreen,->]
\onslide<6->{
\draw[opacity=.7] (1.5,1) to[bend left=23] (9,4.3);
\path[decoration={text along path,raise=2mm,text={area is distance\ \ \ \ \ \ },text align={center}},decorate] (1.5,1) to[bend left=23] (9,4.3);
}
\onslide<7->{
\draw[opacity=.7] (9,4.9) to[bend left=-25] (2.9,3.4);
\path[decoration={text along path,raise=2mm,text={slope is speed\ \ \ \ \ \ \ \ \ \ \ \ \ \ \ \ \ \ \ \ \ },text align={center}},decorate] (2.9,3.4) to[bend left=25] (9,4.9);
}
\end{scope}
\pause
\pause
\end{tikzpicture}
}
\end{frame}